
 4 hours ago
1
4 hours ago
1 
Key Takeaways
STRK has closed above September resistance. Buyers are testing support near $0.051. RSI is overbought and below its September peak.STRK’s 9.5% gain over 24 hours, recorded on CoinMarketCap earlier on October 4, carried it above September resistance before the advance stalled near $0.0595. By 17:00 UTC, price had retreated to roughly $0.0561 on Coinbase’s daily chart, leaving buyers to defend the reclaimed $0.0507–$0.0521 area.
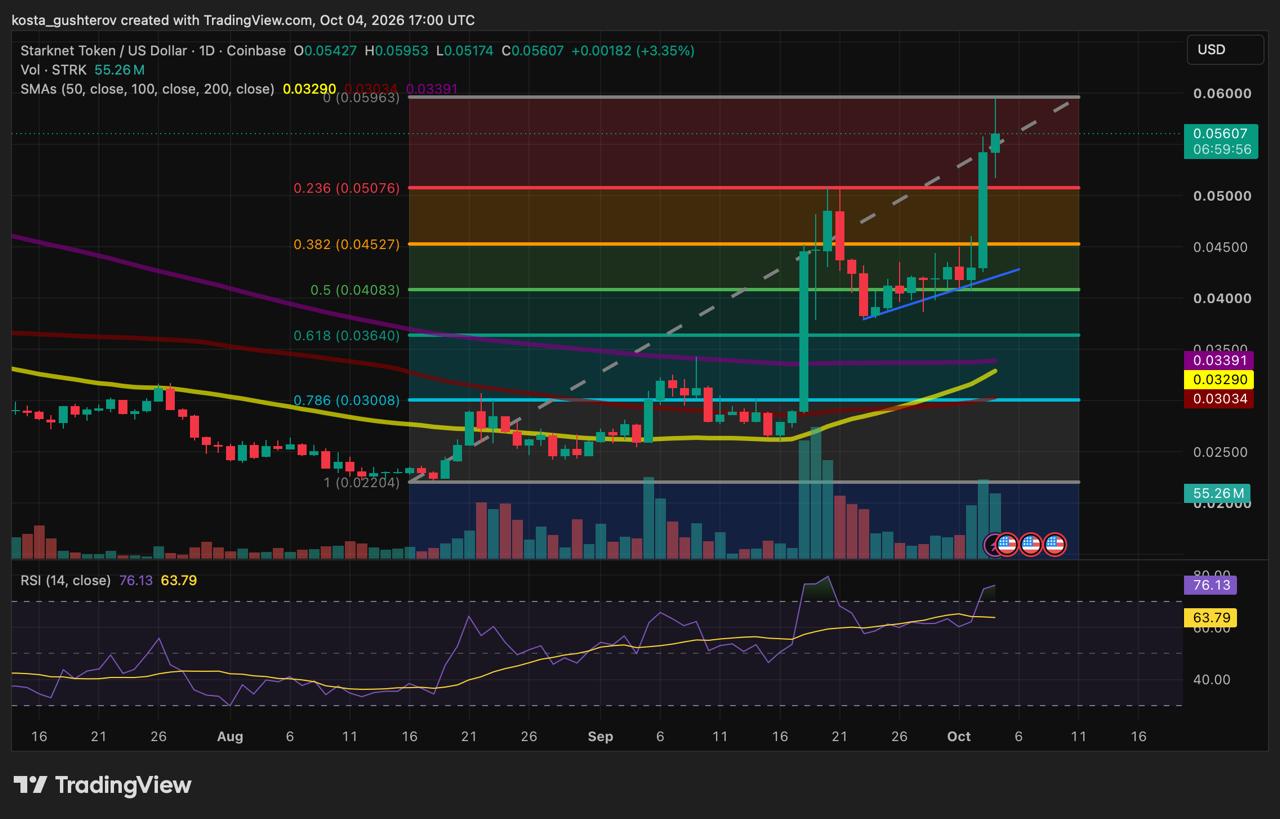 STRK trades above September’s previous high, with the latest pullback testing the breakout zone. Source: TradingView, October 4, 2026, at 17:00 UTC.
September’s higher low set up the latest advance
The recovery began around $0.0220 in August and reached $0.0508 in September before sellers pushed STRK back toward $0.0380. Buyers returned at that higher low, giving the next advance a base from which to challenge September’s peak. The previous daily candle subsequently closed above $0.0508, establishing a higher high after the higher low.
That improvement now depends on how the first pullback develops. Returning to the former resistance is part of testing the breakout; staying below it would raise doubts about whether buyers can sustain the higher trading range.
Buyers have defended the breakout zone once
October 4’s low of $0.05174 brought STRK into the $0.0507–$0.0521 zone before it rebounded. September’s previous high sits within this area, alongside the 0.236 Fibonacci retracement near $0.0508 and the optional 0.20 retracement near $0.0521.
The rebound is an encouraging start, but the daily candle remained open at 17:00 UTC. A close above the zone, followed by a recovery that holds in subsequent sessions, would give buyers stronger evidence of a successful retest. Repeated closes below it would weaken that reading, especially if rebounds began meeting sellers around the same level.
If support holds, STRK would have a basis for another attempt at $0.0595–$0.0600, where the latest advance stopped. Holding above that range would extend the recovery. Another rejection, however, could leave price consolidating between the reclaimed September high and the recent peak.
Below the breakout, September’s base matters most
If the retest fails, $0.0453 is the next Fibonacci reference before the rising blue trendline around $0.042–$0.043. Beneath that line, September’s consolidation leads back to the $0.0380 higher low, where buyers previously stopped the pullback.
| $0.0453 | 0.382 Fibonacci retracement. |
| $0.042–$0.043 | Rising trendline, whose projected support moves higher over time. |
| $0.0380–$0.0410 | September higher low and consolidation, with the 0.50 retracement near $0.0408. |
| $0.0364 | 0.618 Fibonacci retracement. |
| $0.0329–$0.0339 | 50 SMA and 200 SMA area. |
Fibonacci levels use anchors near $0.02204 and $0.05963. A higher upper anchor would change the calculated retracements.
The moving averages lie further below price, with the 50 SMA near $0.0329, the 100 SMA near $0.0303 and the 200 SMA near $0.0339. Recent gains have lifted the 50 SMA, although it remains below the 200 SMA. These averages help describe the recovery over a longer period; the nearer breakout zone and September’s higher low are more relevant to judging the current pullback.

The new price high has not brought a new RSI peak
The speed of the advance has pushed daily RSI to 76.13, above its smoothing line near 63.79. That places it in the overbought range, although Fidelity’s RSI guide notes that strong trends can remain above 70 for extended periods.
The caution comes from the comparison with September: price has exceeded its earlier high, while RSI remains below its corresponding peak. This developing bearish divergence suggests momentum has not strengthened alongside the higher price. With the latest candle still open, RSI could rise further and change that comparison before the session ends.
The rally has nevertheless drawn more trading activity, with recent volume bars larger than much of the preceding consolidation. That pickup supports the advance, even as the RSI comparison raises questions about its strength. October 4’s unfinished volume bar will provide a clearer comparison with earlier sessions once the day closes.
A pullback that settles above September’s old high would allow RSI to cool while preserving the breakout. Repeated closes below that area, followed by failed recoveries, would make the momentum warning more significant. Losing the higher low near $0.0380 would cause greater damage by breaking the price structure that supported the latest rally.
Chart source: TradingView, STRK/USD on Coinbase, October 4, 2026, at 17:00 UTC.
This article is for informational purposes only and does not constitute investment advice. Technical levels are approximate and do not guarantee future price movements.
The post Starknet Rallies 9.5% and Tests September’s Breakout Level appeared first on Coindoo.




 Bengali (Bangladesh) ·
  English (United States) ·