 4 hours ago
7
4 hours ago
7 
TLDR
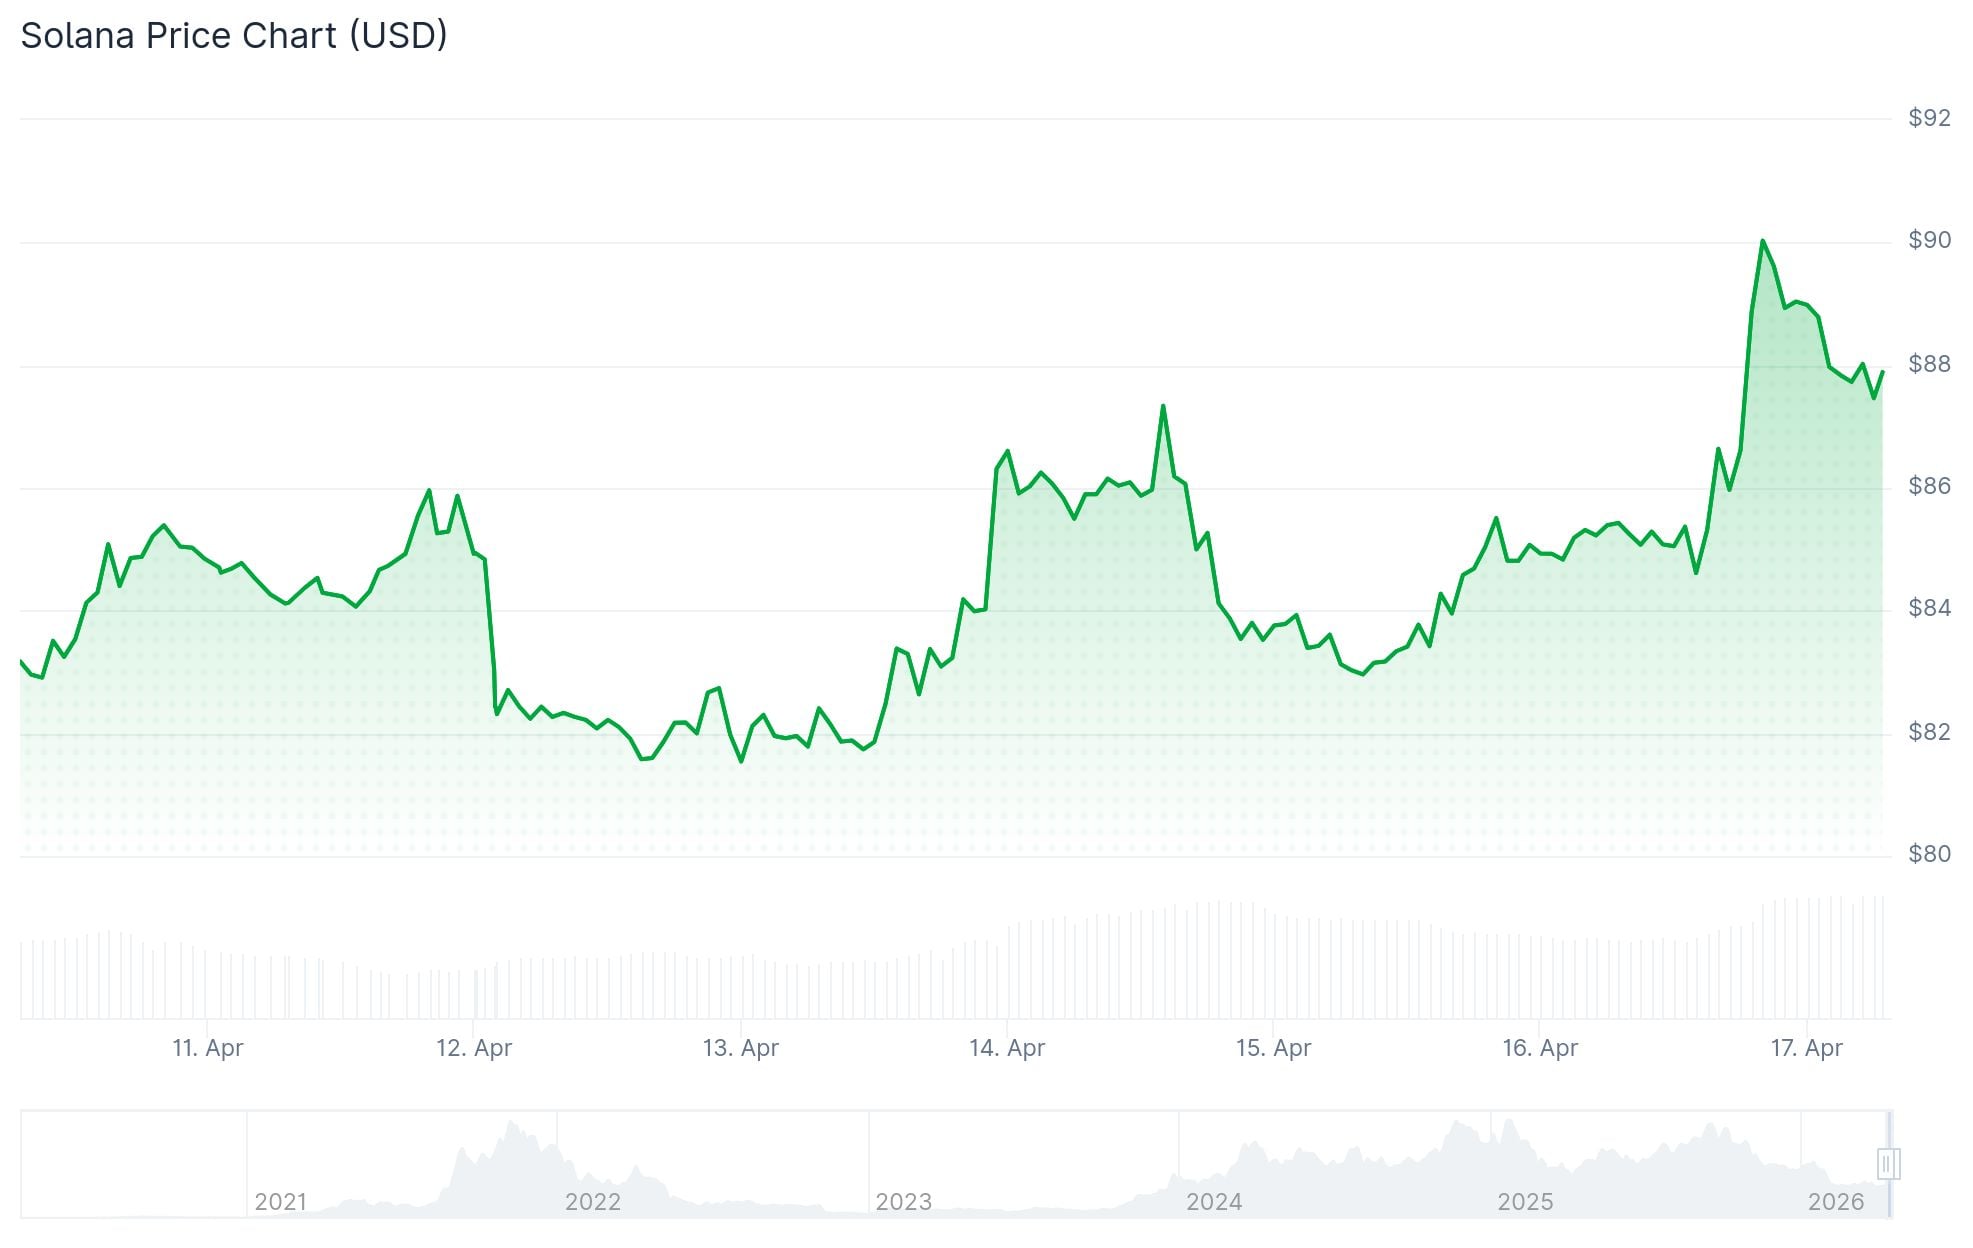
SOL is testing resistance near $84–$87, with key support sitting between $78–$82 A weekly megaphone chart pattern points to a possible $1,000 cycle target if confirmed Solana recorded its first-ever trillion-dollar quarter, with $1.1T in Q1 2026 economic activity Active addresses reached 5.5–5.8 million, well above the 3–4 million range seen in late 2025 On-chain transfer volumes spiked to $75 billion despite SOL’s price lagging behindSolana is sitting at a short-term decision point on the charts. On the 1-hour timeframe, SOL is pushing into a resistance zone in the mid-$84 area after bouncing from support between $78 and $81.
 Solana (SOL) Price
Several Fibonacci levels are stacked tightly in this zone — $84.46, $85.06, $85.56, $86.51, and $87.03. This cluster creates a dense supply area that may be hard to break through in a single move.
If SOL fails to clear this zone, price could fall back toward the $81.65 to $78 support area. A clean break above resistance opens the path toward $87–$88.
On the weekly chart, analyst CryptoCurb on X has highlighted a broadening megaphone pattern. The structure shows repeated touches at both the upper resistance line and lower support line across multiple price swings.
SOL is going to $1,000+ this cycle.#SOLANA  pic.twitter.com/fbWP7Oxusg
— curb (@CryptoCurb) April 15, 2026
The lower boundary of this pattern has held as support. As long as that zone holds, the bullish structure stays intact. CryptoCurb’s projected target, if a breakout is confirmed, sits above $1,000 — though this remains a forward scenario, not a completed move.
Network Activity Hits Record Highs
Away from the price charts, Solana’s on-chain data tells a strong story. The network recorded $1.1 trillion in total economic activity in Q1 2026, according to Artemis data. That is Solana’s first-ever trillion-dollar quarter.
@Solana crosses a major milestone as its Total Economic Activity hits $1.1T in Q1 2026, marking the first trillion-dollar quarter for the network. pic.twitter.com/MoGcsCWCXS
— Solana Daily (@solana_daily) April 16, 2026
For context, Q3 2025 saw around $600 billion and Q4 2025 came in near $850 billion. The quarter-on-quarter jump was nearly 29%.
Active addresses on the network are running at 5.5–5.8 million, up from the 3–4 million range seen through much of late 2025. Address activity even briefly touched 6.5–7 million earlier in Q1.
Solana also led all major blockchains in Q1 2026 by transaction count, processing 25.3 billion transactions during the quarter.
Transfer Volumes Spike
Daily transfer volumes, which had mostly stayed between $5 and $15 billion through late 2025, recently spiked toward the $70–$75 billion range.
The PreStocks DEX on Solana also set a single-day volume record of $28.65 million.
Despite this activity, SOL’s token price has not yet reflected the on-chain growth. Capital movement is picking up, but the price repricing has not followed — yet.
SOL’s most recent price action has it testing resistance near $84, with the $78–$81 zone acting as the base to hold.
The post Solana (SOL) Price: SOL Faces Make-or-Break Resistance While the Network Just Crossed $1 Trillion appeared first on CoinCentral.


 Bengali (Bangladesh) ·
  English (United States) ·