
 8 hours ago
1
8 hours ago
1 
Key Takeaways
$90: The immediate 0.786 Fibonacci resistance and psychological target. $83: The 0.618 Fibonacci marker serving as the nearest baseline support for minor dips. $74.6-$76.8: The critical multi-indicator support shelf combining.Coinbase daily charts shows SOL trading at $90.6 after tapping an intraday high of $91.3, putting the token face-to-face with the 0.786 Fibonacci retracement which is also a psychological barrier near $90.
The surge marks a notable shift in short-term structure. Having defended the 0.618 retracement at $83 and cleared the 200-day SMA at $81 alongside the 50-day and 100-day averages near $76, the immediate question is whether bulls can secure a daily close above $90 rather than just a fleeting wick.
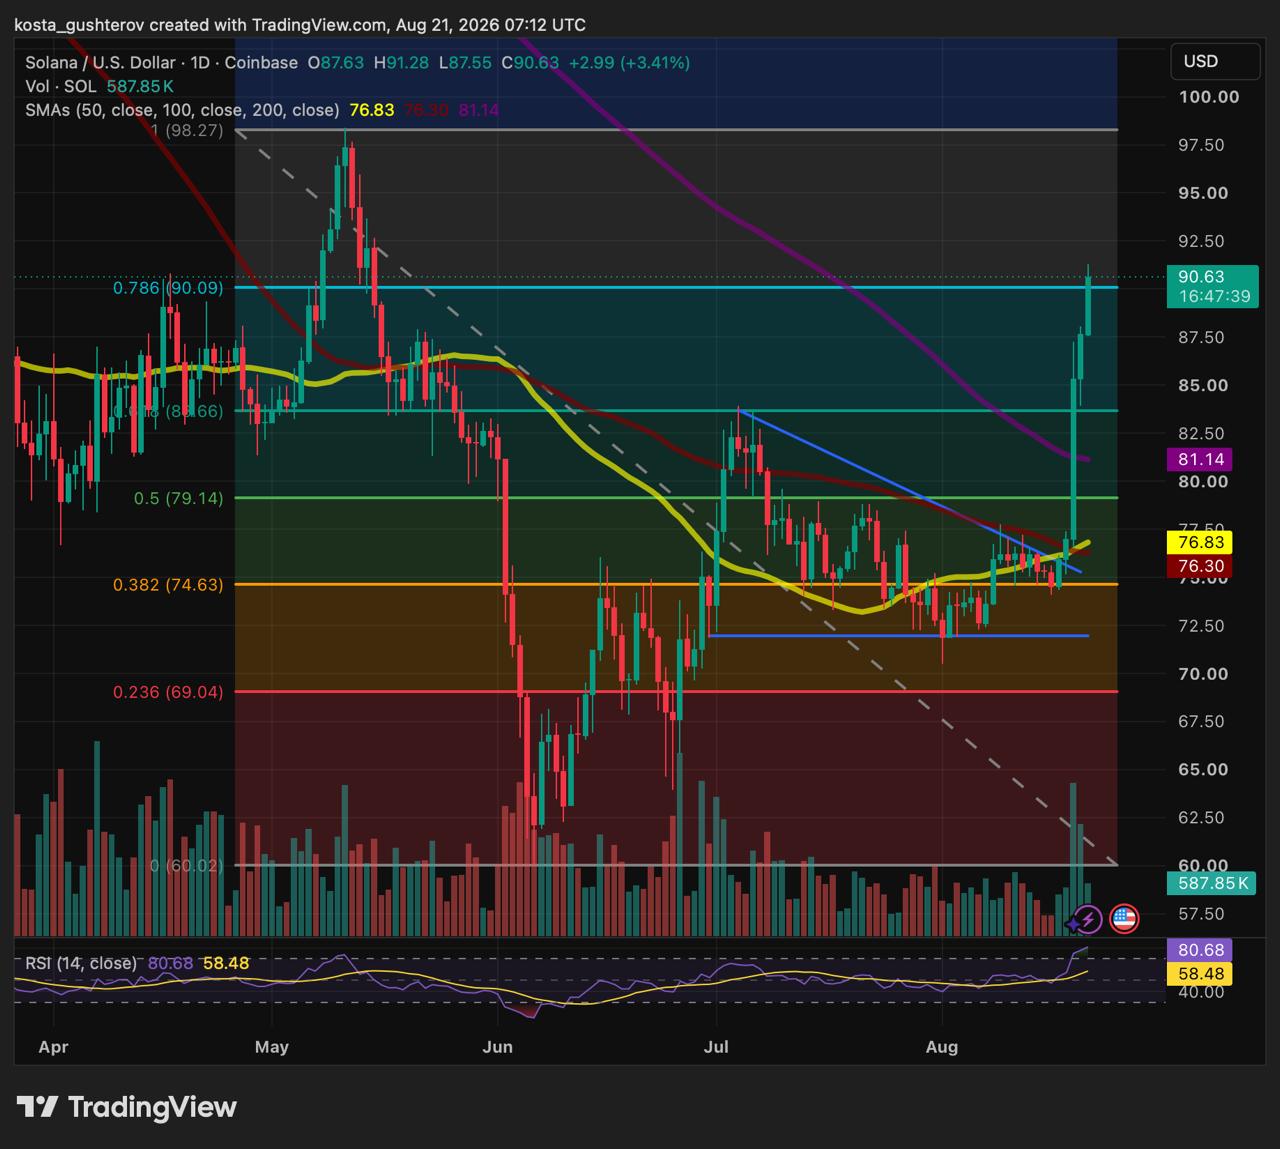 Solana daily price chart highlighting a strong bullish recovery and breakout above major moving average bands.
The daily close holds the final verdict
Measured from its $60 swing low up to $98, the chart puts the 0.786 retracement right at $90. Because this is a late-stage resistance level, with most of the previous drawdown already recovered and the initial spark already used, intraday spikes matter far less than where the daily candle settles.
A confirmed daily close above $90 proves that buyers are actively absorbing supply at these heights. Conversely, a rejection that leaves a long upper wick would signal exhaustion, especially following such a rapid climb.
Momentum indicators reflect that intensity. The daily RSI reads 80.68, climbing well past the 70 overbought threshold. While an elevated RSI isn’t an automatic sell signal, it heavily suggests the price may need to pause or successfully retest lower foundations before making a sustained run at the $98 swing high.
Defending the breakout: $83 vs. the $76 shelf
If a pullback occurs, traders are looking at two distinct defense lines. The first is $83 (the 0.618 Fib level), which served as the launchpad for the latest leg upward. Holding that marker keeps the near-term uptrend intact.
Below that lies a much heavier, multi-layered support shelf. The 50-day SMA ($76.83), the 100-day SMA ($76), and the 0.382 Fibonacci retracement ($74.6) converge tightly in the $74-$76 band, right alongside the descending trendline that suppressed SOL’s price action through July and early August.
That heavy confluence turns the $74.6-$76.8 zone into a critical floor. While a dip to $83.6 would be a mild speed bump, losing the $76 shelf would severely compromise the integrity of the broader recovery.

Faster slot times add wind to the sails
The price action coincides with the rollout of the first phase of SIMD-0525, an ambitious protocol upgrade designed to compress target slot times from 400 milliseconds down to 200 milliseconds across four stages. With initial targets set at 350 milliseconds, Anza’s feature tracker highlights active mainnet feature gating.
While this performance upgrade provides a powerful fundamental backdrop, it shouldn’t be treated as a direct pricing formula. The protocol pairs faster block cadence with adjusted per-slot work limits to keep aggregate processing stable. Even so, improving network expectations can give traders the confidence to push technical boundaries before full performance metrics materialize on-chain.
From sub-average lows to structural recovery
The current technical landscape is a far cry from late June, when SOL was languishing near $71 beneath all major moving averages, a period where analysts pointed to $65 as the ultimate downside pivot. Breaking cleanly back above the 50-day, 100-day, and 200-day averages proves the current rally extends well beyond a routine relief bounce.
Ultimately, Solana’s immediate trajectory boils down to three strict boundaries: clear $90 on a daily close, hold $83.6 on minor dips, and let the robust $74-$76 shelf act as the ultimate safety net for the broader trend.
Source review: Price levels, Fibonacci markers, moving averages, and RSI metrics stem from the supplied TradingView Coinbase SOL/USD daily chart captured on August 21, 2026. Upgrade details are sourced from the official SIMD-0525 documentation and Anza’s feature-gate tracker. The article is provided for informational purposes only and does not constitute investment advice.
The post Solana Eyes $90 Breakout Amid Red-Hot Momentum appeared first on Coindoo.




 Bengali (Bangladesh) ·
  English (United States) ·