
 1 month ago
27
1 month ago
27 
Key Takeaways
SOL has entered the narrow end of a descending price structure after reclaiming Fibonacci support. Two proposed changes would reduce new issuance and make token burning more dependent on network activity. The wider thesis depends on demand from both buyers and Solana users; slower supply growth alone is not enough.Lower Highs Have Pushed SOL Into a Tight Range
SOL traded near $75 on August 15, less than 1% above the 0.382 Fibonacci retracement near $74.5. Directly overhead, the descending blue trendline meets the 50-day SMA near $75.9, with the 100-day SMA at $77. Less than $2.50 separates support from the top of that resistance band.
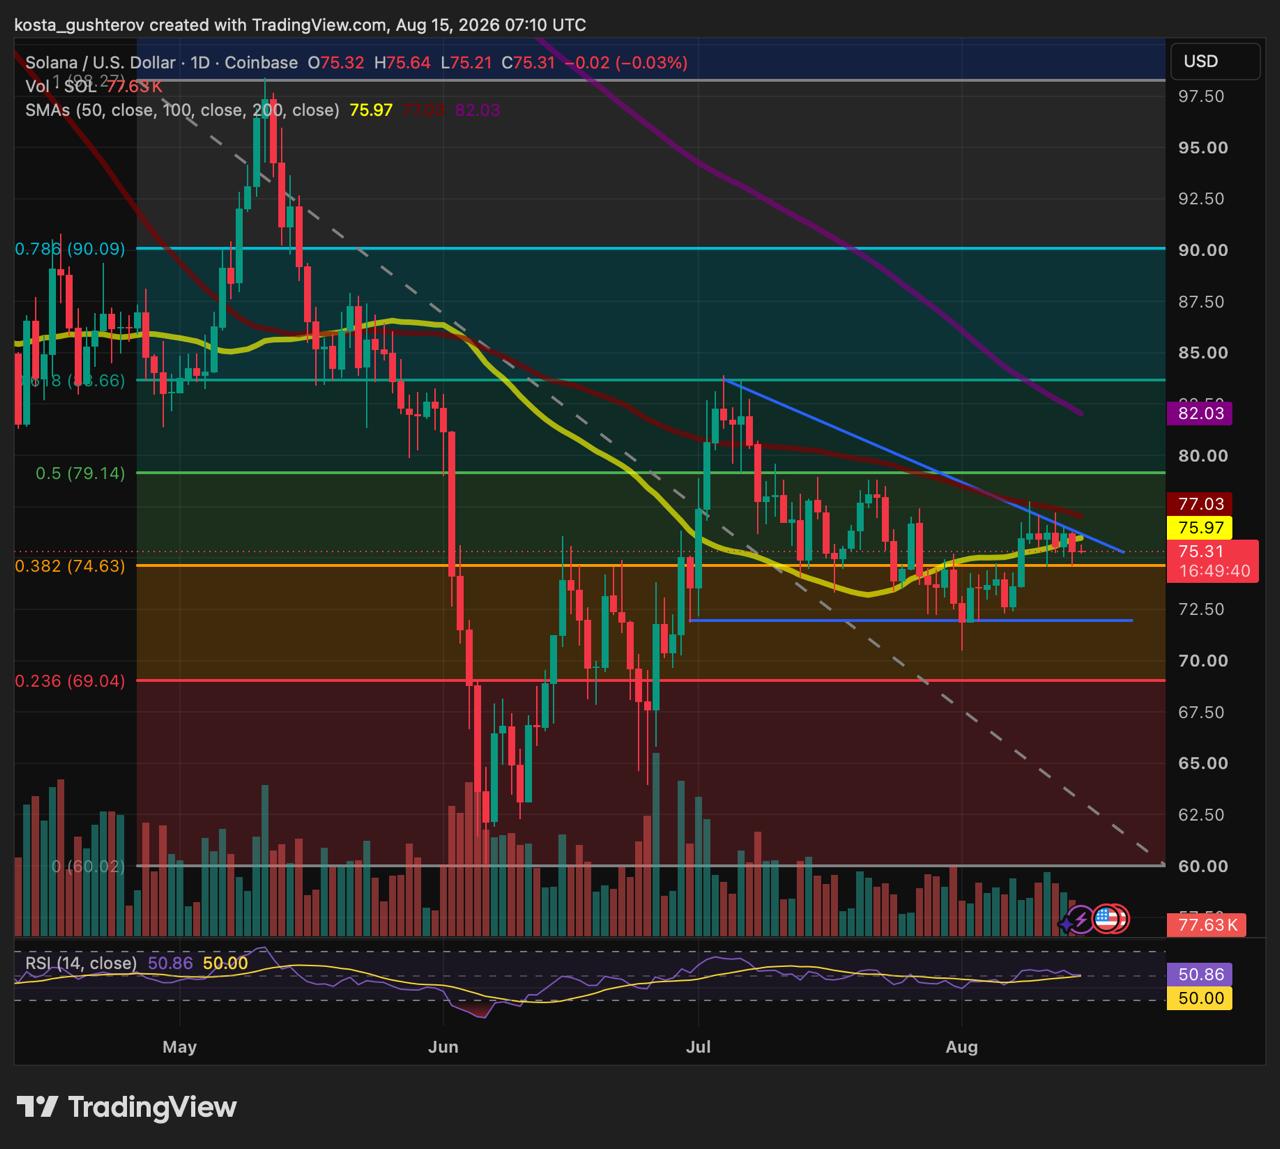 Solana daily price chart testing support near the 0.382 Fibonacci retracement level.
The other side of the structure has held near $71.8. SOL returned to that area around the end of July and again in early August, but sellers could not force a sustained break beneath it.
Buyers then reclaimed Fibonacci support and pushed the price back into the $76 area. The rebound stopped below the descending trendline, and the candles narrowed as support and resistance moved closer together.
A daily close above the full resistance band would open room toward the 0.5 Fibonacci retracement close to $79. The next cluster sits higher, between the 200-day SMA at $82 and the 0.618 Fibonacci level near $83.5.
A close below Fibonacci support would erase the latest reclaim and expose the horizontal triangle base again. If that floor fails, the 0.236 Fibonacci level at $69 becomes the nearest marked support.
Recent candles have crossed nearby levels intraday and closed back inside the range, so confirmation still depends on the daily close and successful retest.
Lower Inflation Would Shift More Weight to Network Demand
Grayscale Head of Research Zach Pandl estimates that SOL’s annual supply inflation could fall to roughly 1.1% by the end of 2031 if the changes under discussion are adopted.
His estimate rests on two mechanisms examined in our analysis of Solana’s proposals to slow SOL supply growth.
Two Proposals Target Different Parts of SOL Supply
SIMD-0550 would reduce new issuance. It would increase the annual reduction in Solana’s inflation rate from 15% to 30%, resulting in an estimated 18.9 million fewer SOL being created over six years. The network would reach its 1.5% issuance floor in the first half of 2029 instead of 2032. SIMD-0553 would increase fee burning. It proposes a resource-based fee that would be burned in full. At its terminal modeled rate, the system could destroy between 7,500 and 9,000 SOL per day if activity resembles the May 2026 sample used by its authors.Together, the changes would move SOL’s economics away from issuance and closer to usage. Fewer tokens would be distributed through inflation, while heavier demand for network resources could produce a larger burn.
Why Slower Supply Growth Is Not Automatically Bullish
Issuance would still exceed burns. The proposal estimates that roughly 60,000 SOL currently enters circulation each day, far above even the projected terminal burn. The likely result is slower supply growth, not an immediately shrinking supply. The burn depends on activity. Fewer transactions would mean fewer tokens destroyed, while resource-based fees that become too costly could discourage some network use. Staking rewards would fall. Unstaked holders would face less dilution, but stakers and validators would receive fewer newly issued tokens. Their outcome would depend on SOL’s price and on whether fees and MEV replace enough of the lost reward income.Pandl’s price argument is therefore conditional: lower supply growth may help if demand holds.
How the Supply Thesis Connects to the Current Squeeze
The two stories operate on different timelines. The chart will determine whether the current recovery can continue, while the proposals – if approved – would shape how quickly SOL dilution falls in the years ahead.
Lower issuance could improve SOL’s supply profile, but only sustained network activity can generate meaningful burns and compensate for lower staking rewards. For now, the chart is testing buying demand; the tokenomics debate is testing whether Solana can rely less on inflation without weakening participation.
The post SOL Is Cornered Near $75 as Solana Rethinks Inflation appeared first on Coindoo.




 Bengali (Bangladesh) ·
  English (United States) ·