A gradual pullback from the $0.82 high illustrates sellers’ increasing control over the market, while buyers struggle to sustain upward trends. Open interest data and volume metrics reveal cautious trader behavior that could determine whether the coin stabilizes or succumbs to further declines.
Open Interest and Price Dynamics Reveal Cautious Sentiment
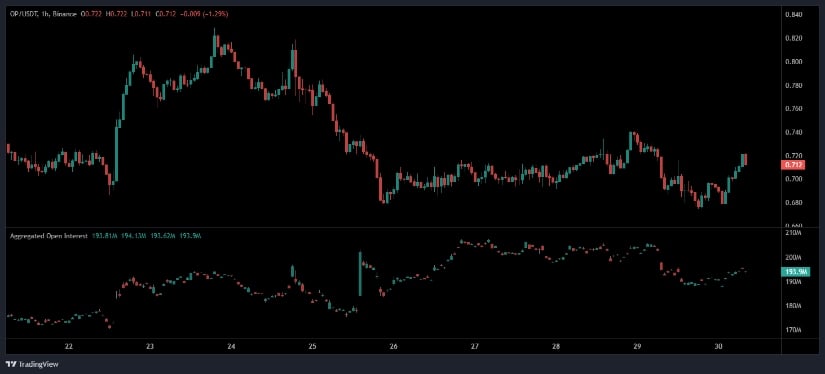
Hourly charts of OP/USDT show price retreating from $0.82 to the $0.70 region amid heightened volatility. Small relief rallies during this period failed to surpass significant resistance, emphasizing buyers’ inability to drive momentum. Despite price weakness, aggregated open interest remains steady near $193.9 million, signaling that traders are largely holding positions rather than exiting.

Source: OpenInterest
This persistent open interest amid declining prices often reflects a short accumulation phase, where market participants position themselves to benefit from further downside, suggesting hesitation among spot buyers.
The correlation between price and open interest offers an important insight into potential market direction. Should the price continue to soften while open interest rises, increased selling pressure could push the asset below the crucial $0.70 support zone. Conversely, if open interest contracts while prices stabilize, this might indicate shorts closing positions, potentially laying the groundwork for a rebound. Consequently, ongoing monitoring of open interest is pivotal for anticipating the memecoins’ next moves in this uncertain environment.
Market Data Confirms Bearish Pressure and Volatile Trading
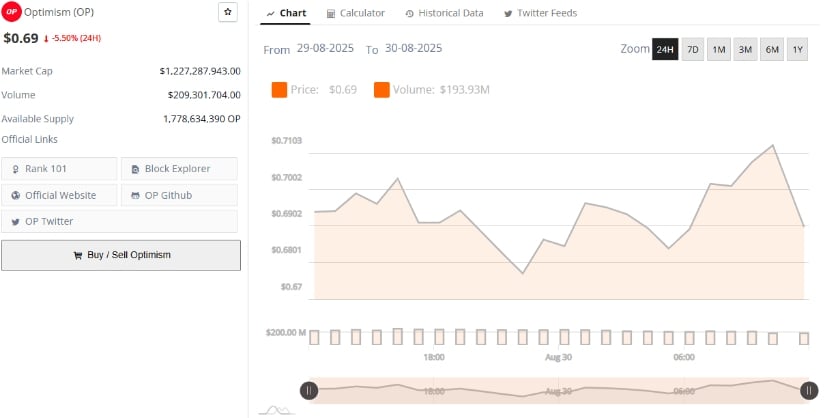
According to BraveNewCoin, OP trades near $0.69, reflecting a sharp 5.5% drop over the last 24 hours. The asset has a market capitalization of approximately $1.22 billion and a daily trading volume exceeding $209 million.
With a circulating supply of around 1.77 billion tokens, the token is classified as a mid-cap cryptocurrency, positioned roughly 101st by global market capitalization. Price action within the last day reveals a clear struggle to hold above $0.70, with multiple tests of the $0.67 zone reinforcing bearish dominance.

Source: BraveNewCoin
Throughout the 24 hours, the token oscillated between $0.67 and $0.71 amid high volatility but lacked a clear direction for a sustained rally. This pattern reflects market indecision where liquidity remains active, but sentiment leans pessimistic.
The repeated inability of buyers to breach the $0.71 resistance weakens the cryptocurrency a near-term recovery. If inflows of buying pressure do not materialize, the risk grows that he memecoin will retest lower support levels, further eroding confidence.
Technical Indicators Point to Oversold Conditions but Lingering Downside Risk
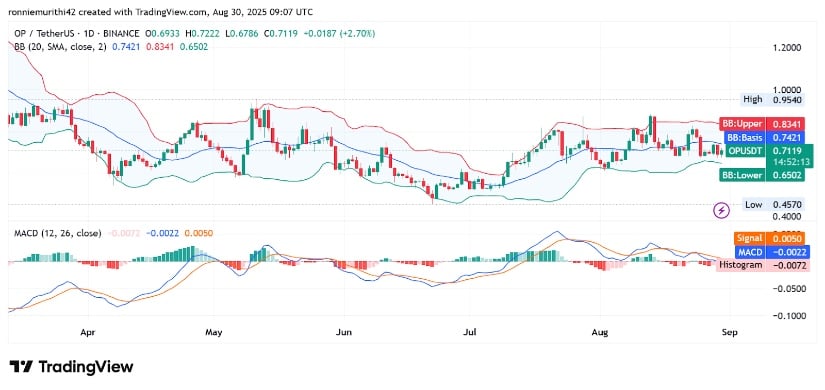
On daily timeframes, the application of Bollinger Bands and MACD indicators paints a picture of waning bearish momentum but continued pressure on prices. Currently priced around $0.712, OP hovers near the lower Bollinger Band at $0.65, a positioning that historically signals oversold conditions, prompting potential short-term relief.

Source: TradingView
The mid-Bollinger Band resistance lies at $0.74, with the upper band near $0.83, levels that signify targets for any recovery rallies.
The MACD remains slightly bearish, with the MACD line below the signal line and a negative histogram; selling pressure persists. Nevertheless, the narrowing gap between the lines hints at a possible slowing of bearish momentum. This suggests early signs that a trend reversal could arise if buying volume increases meaningfully.


 11 hours ago
3


 Bengali (Bangladesh) ·
  English (United States) ·