
 1 hour ago
1
1 hour ago
1 
Key Takeaways
HYPE’s uptrend holds while momentum weakens
HYPE traded near $83.5 on September 8 after falling as low as $81.5, leaving price close to the lower boundary of its daily ascending channel.
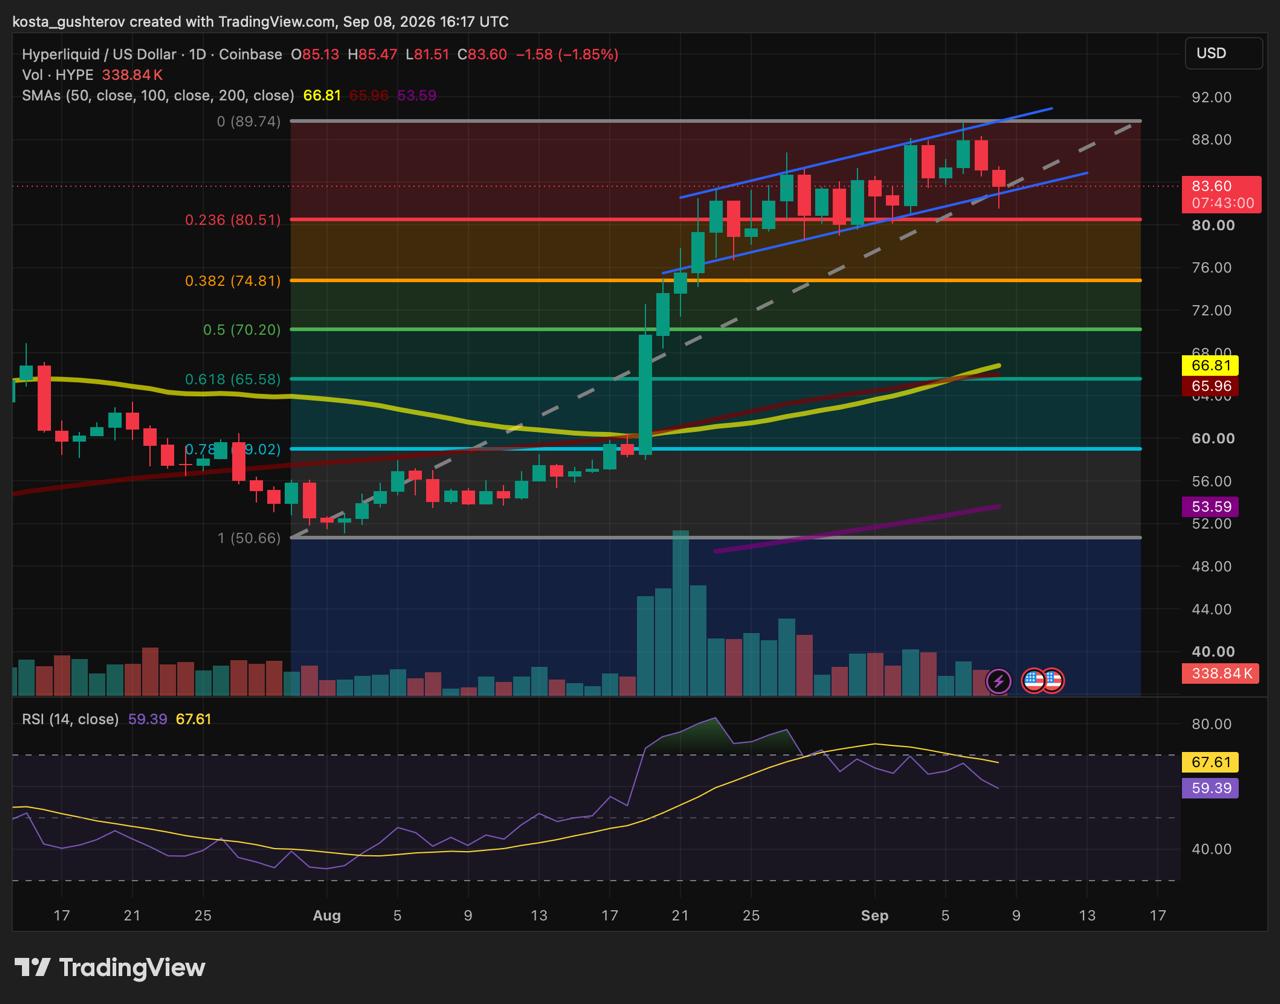 Hyperliquid (HYPE/USD) daily price chart.
After rallying from the $50.5 swing low, HYPE began consolidating inside the channel above $75. The structure continued producing higher highs, including the recent move to $89.
RSI moved in the opposite direction. Price recorded higher highs while the indicator formed lower highs, creating a bearish divergence. With daily RSI at 59.39 and still above the neutral 50 line, the pattern shows weaker bullish momentum rather than a confirmed reversal.
The channel remains intact, so price has not yet confirmed the RSI warning. That would begin to change if HYPE closes below the lower trendline and starts forming lower lows.
$83 support meets the first resistance at $84.5
The four-hour chart places HYPE between two moving averages. Price near $83.7 was below the 50-period SMA close to $84.5 but remained above the 100-period SMA at $83
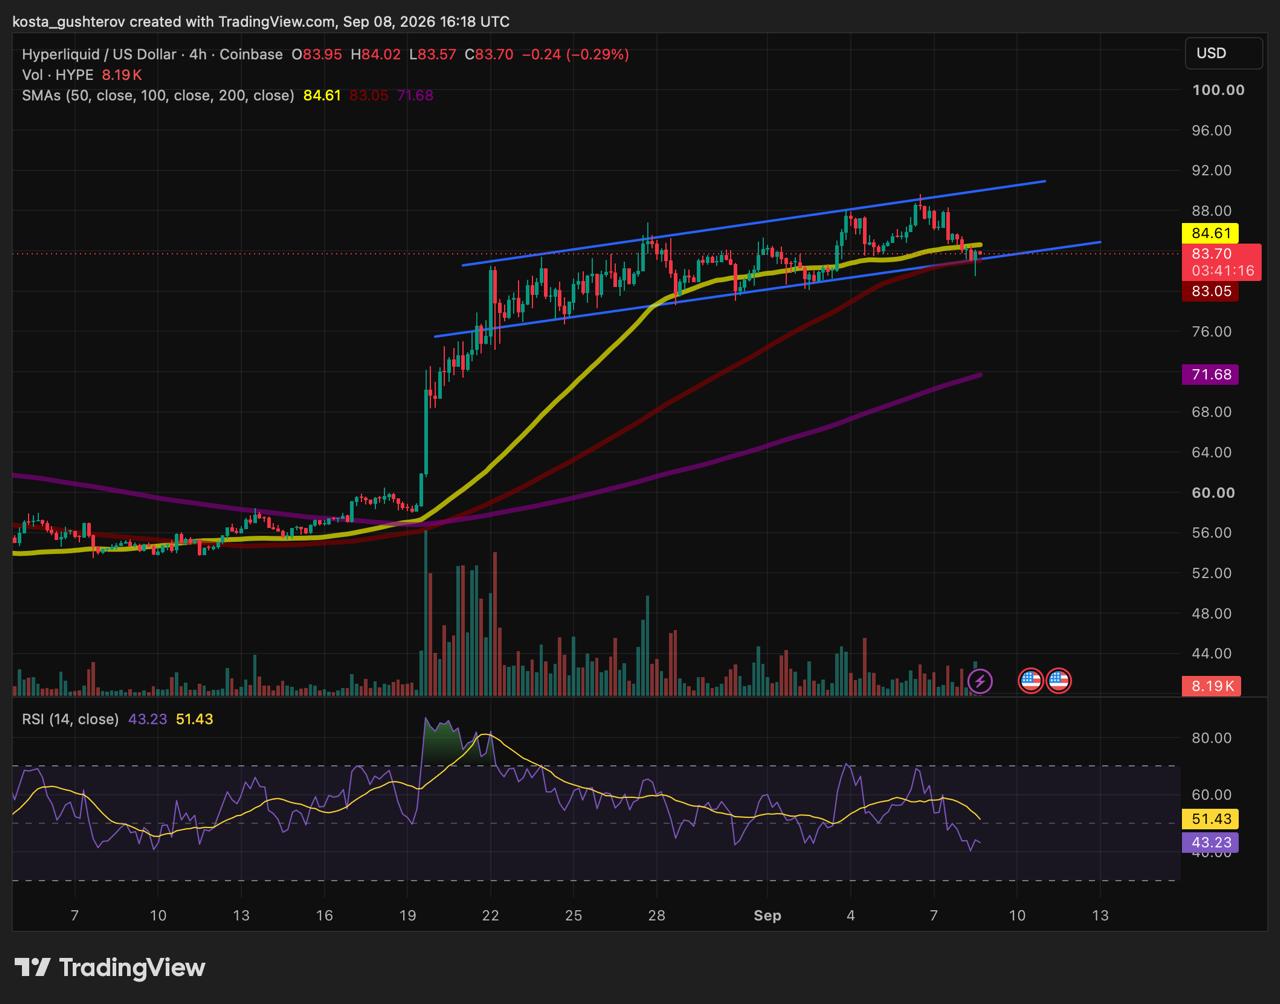 Hyperliquid (HYPE/USD) 4-hour price chart.
The 50-SMA had previously supported the advance and now forms the first recovery test. HYPE needs to reclaim $84.5 and hold above it on subsequent four-hour candles before the average begins acting as resistance.
Below the market, the 100-SMA coincides with the ascending channel’s lower trendline near $83. An intraday wick below the area would not confirm a breakdown; a four-hour close below both the channel and the 100-SMA would carry more weight.
Four-hour RSI had fallen to 43.23, below both the neutral 50 line and its moving average at 51.43. That confirms weaker short-term momentum, although the indicator has not reached oversold territory.
$80.5 might be separating consolidation from a deeper pullback
Holding $80.5 would keep HYPE within a relatively shallow retracement of its advance, even if the four-hour structure weakens. A daily close below it would remove the first fixed support beneath the channel and expose lower Fibonacci and moving-average levels.
HYPE levels to watch
| $89.7 | Recent high and the level needed for a renewed breakout. |
| $84.5 | Four-hour 50-SMA and the first recovery test. |
| Near $83 | Four-hour 100-SMA and the channel’s lower trendline. |
| $80.5 | Daily 23.6% Fibonacci retracement and the main structural support. |
| $74.8 | Daily 38.2% retracement if $80.51 fails. |
| $70-$72 | Four-hour 200-SMA and daily 50% retracement. |
| $65.5-$66.8 | Daily moving averages and the 61.8% retracement form deeper support. |
The $70-$72 area would become particularly relevant during a deeper correction because the four-hour 200-SMA at $71.6 sits close to the 50% Fibonacci retracement at $70.20.
Derivatives dominate HYPE trading
CoinGlass showed approximately $3.37 billion in aggregated HYPE futures open interest on September 8. Over the same 24-hour period, futures volume reached about $2.35 billion, compared with approximately $160 million in spot volume. Futures turnover was therefore around 14.6 times larger than spot trading.
Open interest measures the value of derivatives positions that remain outstanding, while volume shows how much trading occurred during the period. Together, the figures indicate that most HYPE trading activity is taking place through derivatives rather than direct spot purchases.
That distinction matters near an important support area because leveraged positions can be closed voluntarily or forced out through liquidations, potentially accelerating a move once price breaks a widely watched level. Open interest does not show whether traders are predominantly bullish or bearish, however, because every futures contract has both a long and a short side.
CoinGlass recorded approximately $4.48 million in HYPE liquidations over 24 hours, equivalent to roughly 0.13% of reported open interest. The relatively small figure does not indicate that the market had already undergone broad forced deleveraging. A large pool of open derivatives exposure therefore remained in place as HYPE tested support.
Protocol fees create a separate source of HYPE demand
The derivatives data explains why a technical breakdown could become volatile. Hyperliquid’s fee mechanism addresses a different question: whether activity on the protocol creates recurring demand for HYPE itself.
Hyperliquid says 99% of relevant protocol revenue is directed to the Assistance Fund. The fund automatically uses that revenue to purchase HYPE, and the acquired tokens are burned. The mechanism therefore links eligible trading fees to recurring token purchases and a reduction in supply.
DeFiLlama recorded approximately $201.83 million in gross protocol revenue during Q2 2026. That total should not be treated as the amount used to purchase HYPE. Builder fees and other excluded revenue are not fully directed to the Assistance Fund, so gross revenue is larger than the sum available for token purchases.
The fee mechanism can support HYPE’s longer-term token economics, but it does not establish a price floor or prevent corrections. The token demonstrated that distinction when it pulled back after it reached a new high near $90. The buy-and-burn system is a structural source of demand, not a signal that determines when traders should enter or exit a position.
HYPE’s next breakout needs more than a higher price
The bearish RSI divergence is a warning, not a sell signal by itself. The bullish case would strengthen if HYPE holds its ascending channel, reclaims the four-hour 50-SMA and eventually clears $89.7 while daily RSI forms a higher high. That combination would show that momentum is catching up with price.
Repeated failures below the four-hour 50-SMA would point to a weaker recovery. A four-hour close below the channel and 100-SMA would provide the first evidence of a breakdown, while a daily close below $80.5 would confirm broader structural damage. Either move would carry more significance if accompanied by rising trading volume rather than a brief intraday wick.
Investors should also monitor whether spot demand begins catching up with futures activity. A rally supported by increasing spot volume would be less dependent on leveraged positions. If open interest rises sharply while spot volume remains weak, the market could become more vulnerable to liquidations during a reversal. Falling price combined with declining open interest and increasing liquidations would indicate that leveraged positions are being forced out.
For a longer-term view, protocol revenue and Assistance Fund purchases are more useful when tracked over several months rather than individual trading sessions. Until price, RSI, volume and spot participation begin pointing in the same direction, HYPE’s uptrend remains intact but its next breakout is not yet confirmed.
This article is for informational purposes only and does not constitute financial advice.
The post HYPE Price Holds Channel as RSI Diverges: Levels to Watch appeared first on Coindoo.



 Bengali (Bangladesh) ·
  English (United States) ·