
 1 month ago
13

Key Takeaways
HYPE bounced from $77 support. Four-hour RSI now shows bearish divergence. HYPE traded near $80.50 at writing. Channel resistance meets $80.5 Fibonacci resistance. $81.50-$84 is the next barrier.HYPE rebounds into a crowded resistance zone
HYPE fell toward $77 before the decline slowed. The range combined prior horizontal support, the four-hour 200-period simple moving average and the lower edge of the descending channel.
Those levels do not guarantee that a price will hold. Their overlap, however, made the area one traders were likely to defend. The rebound has now brought HYPE to the opposite side of the channel, where buyers face a much harder task.
A bearish RSI divergence appears at resistance
The four-hour relative strength index, or RSI, shows a bearish divergence: HYPE’s price has pushed higher while the RSI has produced a lower high. In simple terms, the recovery has lifted the price, but momentum has not kept pace with it.
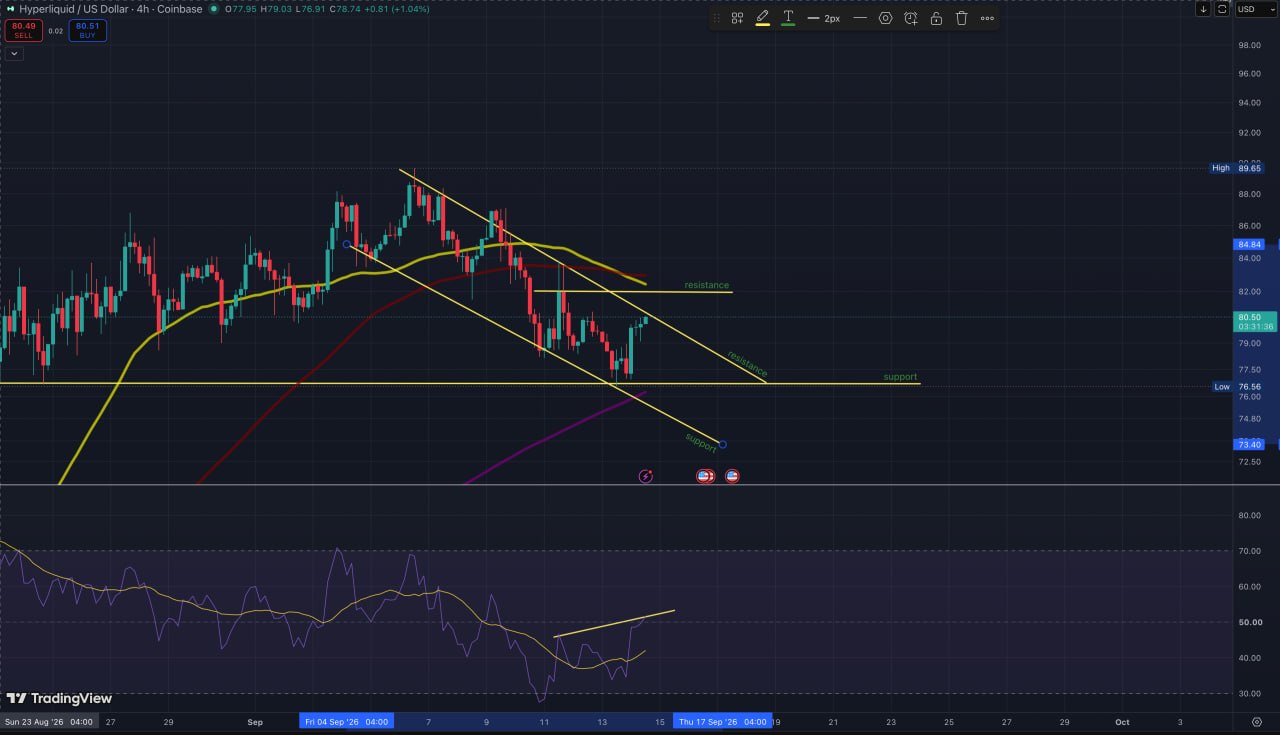 Hyperliquid four-hour price analysis chart.
Bearish divergence does not brings a decline everytime but it becomes more relevant when it appears as price reaches resistance, as HYPE has done near the channel’s upper boundary. A break and close above that area would weaken the warning; rejection would give it more weight.
Channel resistance and the $80.5 Fibonacci level converge
HYPE traded near $80.50 at the time of writing, directly below the upper boundary of its four-hour descending channel around $80.50-$81. The daily 0.236 Fibonacci retracement sits almost beside it at $80.5.
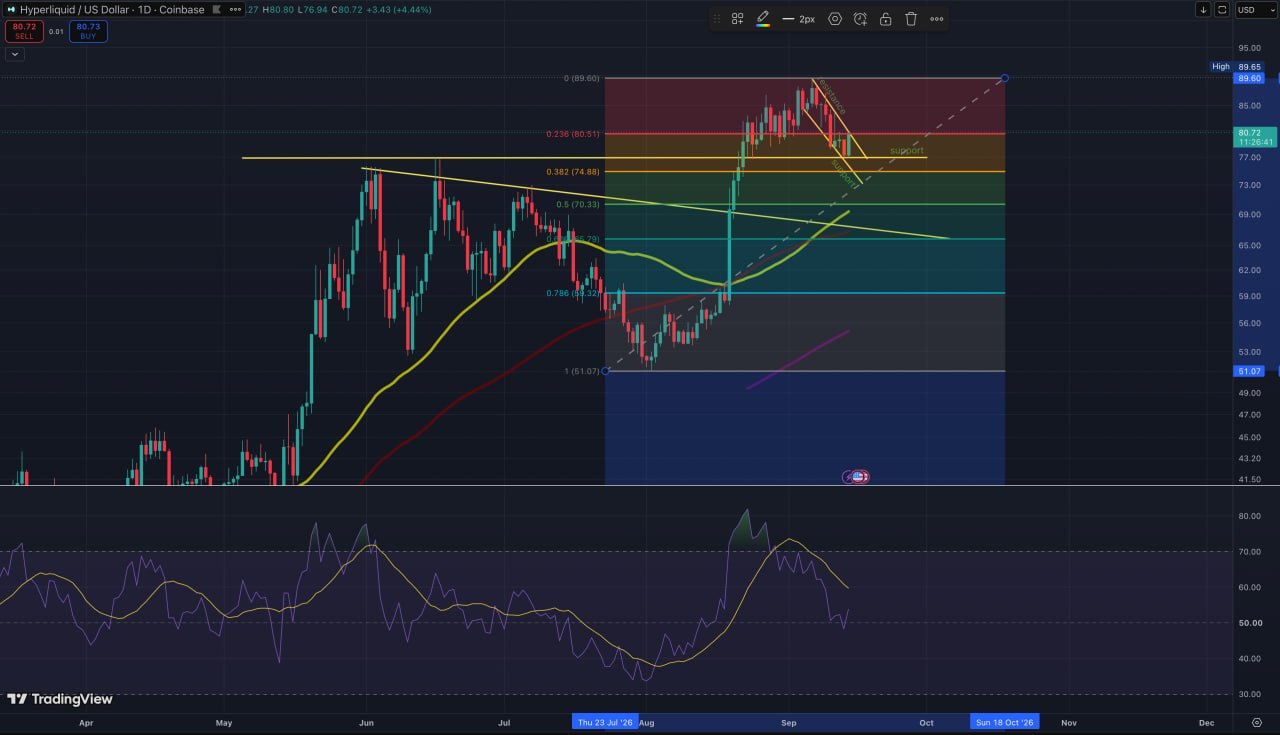 Hyperliquid daily Fibonacci retracement chart from TradingView.
Fibonacci retracements are chart levels traders use to assess how much of an earlier move has been recovered or given back. Here, the level acts as resistance because HYPE is trying to reclaim it from below.
A four-hour close above the channel would show that HYPE has broken its short-term downtrend. A daily close above $80.5 would add a second confirmation. If price later pulls back and holds above that level, the former resistance would begin to act as support.
Upper channel boundary and daily 0.236 Fibonacci retracement.
Horizontal resistance, the four-hour 50- and 100-period moving averages, and a wider supply area.
Prior price support, the four-hour 200-period moving average and the channel floor.
The daily 0.382 and 0.5 Fibonacci retracement levels beneath current support.
The $81.50-$84 zone is the next barrier
A break above the channel would only move HYPE into the next resistance area. Horizontal resistance begins near $81.50-$82, where the four-hour 50- and 100-period moving averages are also clustered. The wider zone extends toward $84.
For the chart to shift higher, HYPE would need to hold above $80.5 and then trade through this $81.50-$84 range. A move with stronger volume would support the breakout more than a single low-volume candle.
The recent chart high near $89.60 would become the next higher reference point if that resistance cluster is cleared. It is not an automatic destination; the price first needs to establish support above the levels now overhead.
Failure near $80.50-$81 would return focus to support
If HYPE trades above the channel briefly but closes back inside it, the move would leave the short-term descending structure intact. The bearish RSI divergence would then align with the price rejection, bringing $77 back into focus.
A break below that range would expose the daily 0.382 Fibonacci retracement near $75. HYPE has not revisited this level since the August rally, making it a deeper test of that advance. A daily close below $75 would place the 0.5 retracement around $70.3 in view.

The setup arrives during a busy week for crypto
The technical test comes as crypto markets face events that could affect risk appetite more broadly. The Senate is scheduled to vote on the CLARITY Act on September 15.
Attention will then turn to the Federal Reserve decision later in the week. Our analysis of Bitcoin entering Fed week explains why the outlook offered by policymakers may matter for crypto prices. A sharp move in Bitcoin or the wider market could influence whether HYPE can hold a break above resistance.
The $80.5 close now carries heavy weight
The defence of $77 gave HYPE room to rebound, but the token is now pressing into resistance while the RSI shows fading upside momentum. The next daily close should clarify which force is stronger.
A close above $80.5 would put HYPE in position to challenge the $81.50-$84 cluster. A rejection would leave the mid-$70s support range exposed to another test.
This article is provided for informational purposes only and does not constitute financial or investment advice. Technical levels can change as market conditions develop.
The post HYPE Price Faces Its First Major Test After the $77 Bounce appeared first on Coindoo.




 Bengali (Bangladesh) ·
 English (United States) ·