
 2 hours ago
4
2 hours ago
4 

This surge in accumulation from accounts holding one million and ten million tokens or more signals growing confidence by major investors, even as the broader market grapples with selling pressure and price resistance near $0.22.
The contrasting trends between whale activity and technical momentum position the asset at a crossroads, potentially setting the stage for a significant breakout or extended consolidation.
Whale Accounts Show Significant Growth
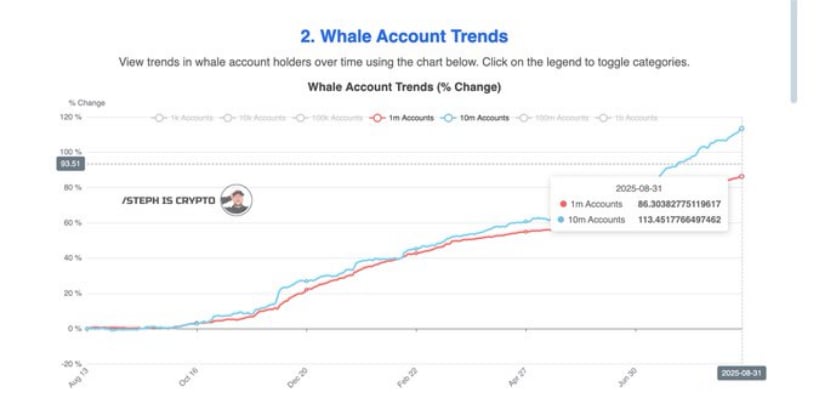
Data from analyst STEPH IS CRYPTO highlights a striking rise in the number of whale accounts holding substantial amounts of HBAR. The chart tracks two categories: holders of one million tokens or more (blue line) and those with ten million tokens or more (red line).
Both groups have experienced notable growth, but the ten million-plus category has surged especially steeply by August 31, 2025. This accelerated accumulation reveals heightened institutional and large-scale investor interest.
Source: X
The sustained addition of such large quantities of the tokens by whales suggests a strategic positioning ahead of upcoming market catalysts. This accumulation trend reflects increased confidence in the asset’s long-term prospects despite short-term volatility, showing that prominent holders may be preparing for upward price moves.
Importantly, this behavior often precedes market rallies when supply constricts due to reduced selling pressure from significant holders.
Market Data Indicates Consolidation with Cautious Sentiment
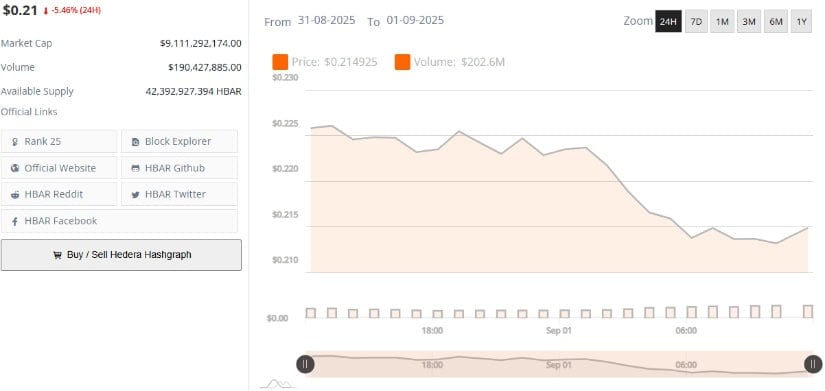
According to BraveNewCoin’s data covering August 31 to September 1, 2025, HBAR’s price hovers near $0.21 but has declined by about 5.46% in the last 24 hours. Meanwhile, daily trading volume has decreased from $202.6 million to $190.4 million, signaling reduced trading activity and possibly a pause as market participants adopt a wait-and-see stance.
The token’s market capitalization remains robust within this context, although price action shows resistance around $0.22.
Source: BraveNewCoin
Price fluctuations confined between $0.21 and $0.22 underscore trader focus on this range as a critical juncture. A decisive breakout above $0.22 could unlock higher price targets, fueled in part by the underlying whale accumulation observed.
Conversely, failure to breach resistance coupled with continued volume declines may maintain downward pressure or prolong the consolidation phase.
Technical Indicators Reflect Bearish Pressure but Potential Support
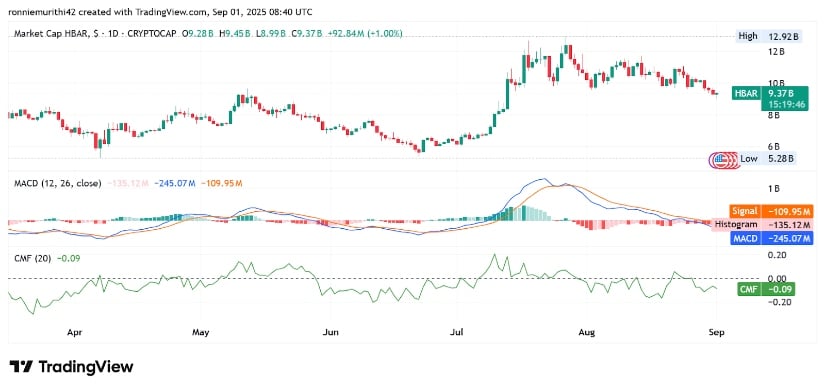
On the technical front, TradingView charts reveal notable bearish momentum. The MACD shows a widening gap between the MACD and its signal line, with the histogram confirming negative momentum that could lead to further price declines absent a reversal.
Similarly, the Chaikin Money Flow (CMF) indicator is negative, indicating capital outflows from HBAR and affirming selling pressure in the near term.
Source: TradingView
Nonetheless, the critical support near $0.21 may serve as a floor, providing a potential bounce point if buying interest emerges from the accumulation trends.
Traders and investors will closely monitor these levels, as sustained support combined with renewed inflows could counteract the current bearish signals and set the stage for a renewed upward push.


 Bengali (Bangladesh) ·
  English (United States) ·