
 27 minutes ago
4

Key Takeaways
ETH at $1,831 after a $1,700 low Low tagged the demand box’s upper edge 0.786 Fib near $1,785 reclaimed, close pending $2,002 is the first resistance that mattersCoindoo’s previous Ethereum update tracked the unwinding of the August breakout and the test of $2,000; that level has since gone, and four red sessions have carried the price from around $2,200 to the floor discussed below.
Why Does $1,700 Matter So Much?
Because the chart has been drawing the same box for two years. The shaded zone on the Binance daily runs from $1,400 to roughly $1,700, with a midline near $1,555, and it is where each of Ethereum’s major turns has been made since the spring of 2025. The April 2025 bottom formed inside it before the run above $3,400. The February 2026 capitulation wick stopped at its upper boundary, close to $1,710, and reversed to above $2,500. The June-July 2026 double bottom was built on its lower half, around the 1.0 retracement near $1,500, and launched the rally to the $2,800 peak.
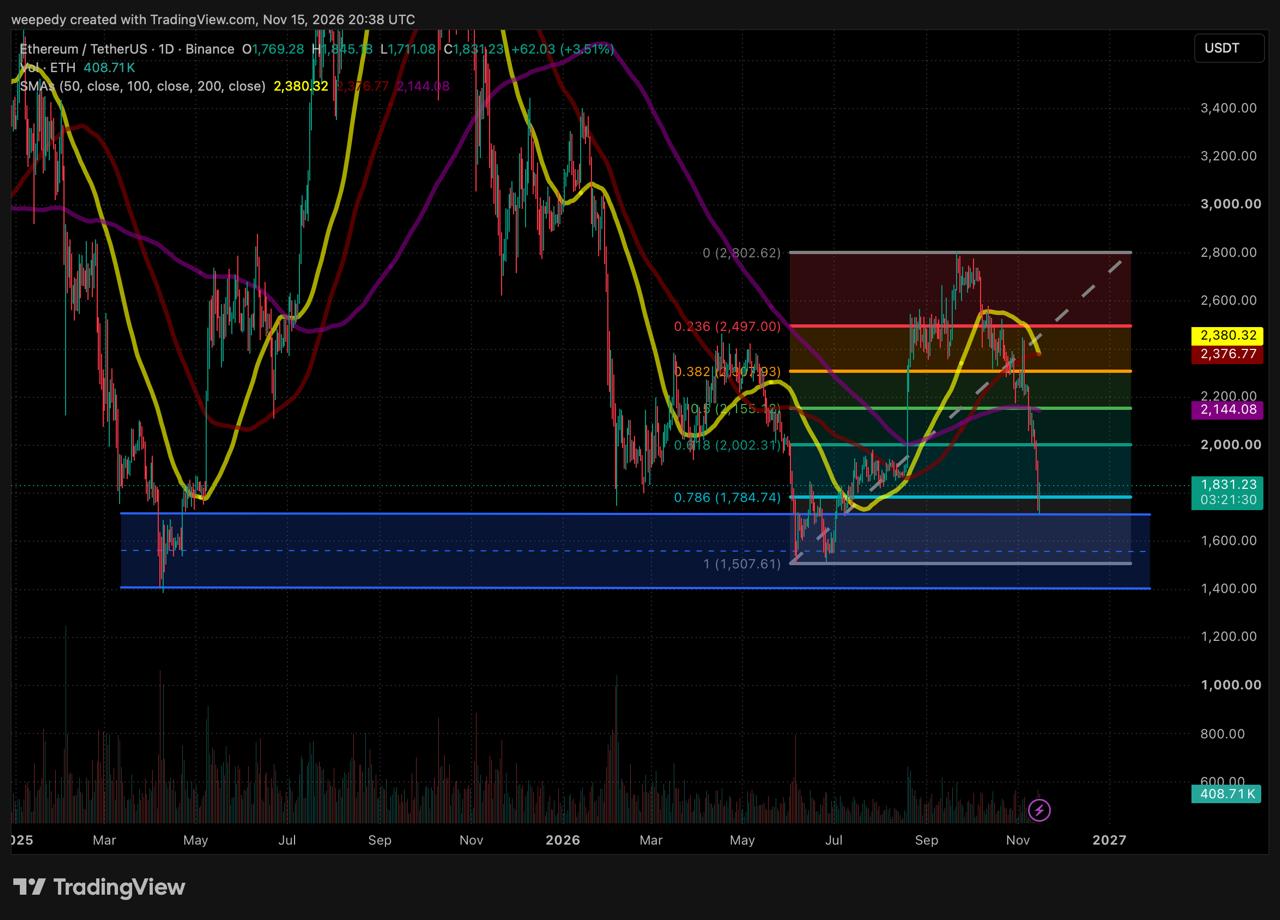 ETH/USDT daily chart, November 15, 2026. Source: TradingView
Sunday’s low printed at $1,700. That is the top edge of the box to the dollar, which is why the bounce that followed, more than $120 from the low to the current $1,831, reads as a reaction to a known level rather than a random intraday turn.
What Has the Bounce Actually Achieved?
Less than the percentage suggests. ETH is up $62, or 3.52%, on the session, with a high of $1,845 and 408.74K ETH traded so far. Saturday closed at $1,769, just under the 0.786 retracement near $1,785; Sunday opened there, dipped to the box, and is now back above the Fibonacci line. The candle shows a long lower wick and a close, if it holds, above the previous close. Whether that is enough to call the level reclaimed is decided in a little over three hours.
What Stands in the Way Above?
Three layers, each a confluence rather than a single line. The first is the 0.618 retracement around $2,002, which sits on the round $2,000 figure and was cut through this week without any pause. The second is the 0.5 level near $2,155 paired with the 200-day SMA at $2,144, the cluster that broke earlier in the week. The third is the 50-day SMA at $2,380 crossing down through the 100-day at $2,377, a bearish crossover forming well above the market after both averages failed around the 0.236 and 0.382 tiers near $2,497 and $2,308.
The relief case therefore has a defined shape. If the 0.786 near $1,785 holds into the close and price clears $1,845 in the coming sessions, the move it sets up is a return toward $2,002, where the first real sellers are likely to be waiting. Only a daily close back above $2,002 would put the $2,144–$2,155 cluster on the table; a rejection anywhere between $1,900 and $2,002 would leave the relief bounce as a partial retracement inside the downtrend.
What Could Happen if $1,700 Goes?
Then the box opens. A close below $1,785 that is followed by a break of todays low would mean the market has moved from testing the zone’s edge to trading inside it, and the chart gives three references on the way down: the dashed midline near $1,555, the 1.0 retracement at $1,508 where the June-July double bottom sits, and $1,400 at the base, which is the level from April 2025 and the one whose loss would end the two-year structure altogether.
The argument for this path is structural rather than about today’s candle. ETH is well under its 200-day average, the two shorter averages are crossing bearishly above it, and the dip only touched the box’s top line. The deeper liquidity, where the summer base was actually built, has not been revisited; the view that it will be is a reading of the structure, not something the chart has yet confirmed.
What Neither Path Changes
Whichever way the close goes, Ethereum remains below every trend filter on the daily chart and below all but one tier of the retracement grid that runs from $1,500 to $2,800. A successful bounce to $2,002 would recover one broken level; a flush into the box would test a floor that has held three times. The difference between the two outcomes, for now, is $74: the gap between the current $1,831 and the $1,785 line that Sunday’s candle has to hold.
The post Ethereum Tests $1,700 Demand Zone, Rebounds 3.5% appeared first on Coindoo.





 Bengali (Bangladesh) ·
 English (United States) ·