 3 hours ago
3
3 hours ago
3 
Ethereum whale holdings rose by 140,000 coins between May 1 and May 3, worth approximately $322 million at current prices, according to Santiment data reported by Ali Martinez. That is not a small position. It is a directional bet by the addresses with the most to lose from being wrong.
Whales have gone on a buying spree, accumulating over 140,000 Ethereum $ETH in the last 96 hours, worth around $322 million. pic.twitter.com/uHZqV3B0W9
— Ali Charts (@alicharts) May 3, 2026
The question the accumulation does not answer: accumulation toward what?
Whales Are Buying Higher, Not Cheaper
The CryptoQuant Spot Average Order Size chart for the past month shows something the headline accumulation number obscures. Whale orders in early April were clustering at $2,005K to $2,100. By late April they moved to $2,250 to $2,300. On May 2, the largest visible order block hit at $2.3168K – 556 ETH in a single spot transaction.

Whales did not accumulate on weakness. They followed price upward and kept buying. That behavior is distinct from bottom-fishing. It signals conviction that the current price is not the top, not that the current price is cheap.
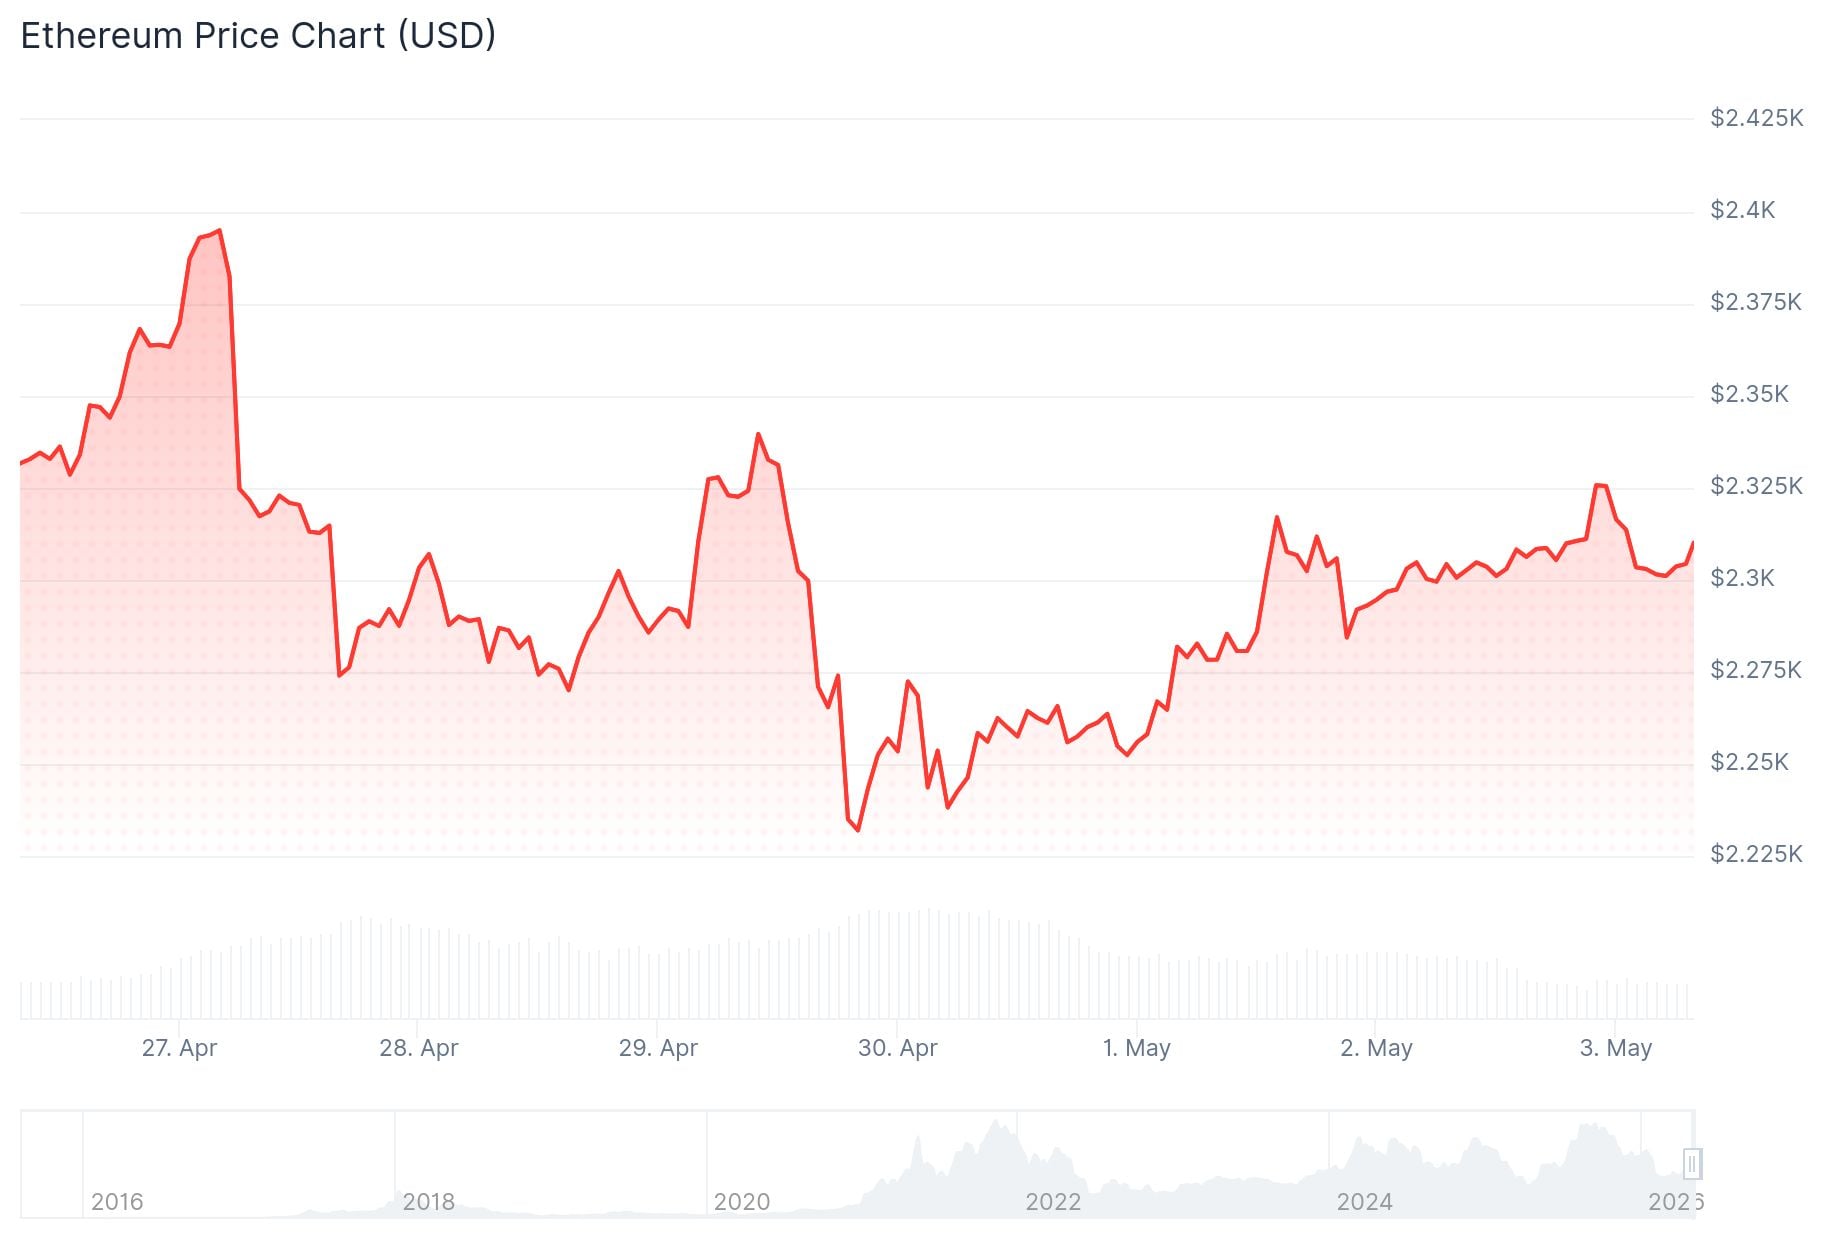
Price at $2,310, now sits above all three moving averages: the 50-MA at $2,302.55, the 100-MA at $2,287.82, and the 200-MA at $2,301.67. The 1H RSI reads 55.87. No technical condition is blocking continuation. The chart is not overbought. The accumulation has structural support.

The Ratio That Overrides the Dollar Chart
The condition the dollar chart cannot show: ETH/BTC sits at 0.02940.
Michael van de Poppe, who has tracked this chart across multiple cycles, places the breakout level at 0.032 BTC. ETH is currently 8.2% below that level. Van de Poppe’s stated bear case is 0.026 BTC, a level that implies ETH underperforms Bitcoin by a further 12% from here, even if ETH’s dollar price does not fall sharply.
This is not great for $ETH.
I've been covering this chart multiple times.
If it clearly breaks 0.032 $BTC, that's where the party starts and when we can expect to have a lot of fun.
If it doesn't, then the next area is 0.026 $BTC and given that we're expecting Bitcoin to run… pic.twitter.com/ziCq3ahzXZ
— Michaël van de Poppe (@CryptoMichNL) May 2, 2026
That distinction matters. Whales accumulating $322 million in ETH can be simultaneously correct on ETH in dollar terms and wrong on ETH relative to BTC. An ETH/USD position is a bet on ETH. An ETH/BTC position is a bet on ETH outperforming the asset that currently holds cycle dominance.
The ratio says cycle dominance has not shifted. Bitcoin, by van de Poppe’s own framing, may still run to $93K before ETH gets its turn. If that sequence plays out, ETH at $2,311 is not undervalued. It is waiting.
What the Accumulation Mechanism Actually Implies
When whale holdings rise by 210,000 ETH gross while price climbs from the $2.05K range to $2.31K, one mechanism is operating: supply is being absorbed faster than sellers can replace it. That absorption is what prevents price from reversing sharply despite the ETH/BTC weakness.
The on-chain picture and the ratio picture are not contradicting each other. They are describing two different timeframes. On-chain accumulation is a near-term signal — supply pressure is down, demand from large buyers is up, price has technical support. The ETH/BTC ratio is a medium-term signal. Until ETH breaks 0.032 BTC, the rotation that drives sustained altcoin outperformance has not begun.
Whales buying $322 million at current prices are positioned for the near-term. The ratio tells them they may need patience on the larger thesis.
The Bear Case and Why It Is Not Dismissible
The counter-argument is this: whale accumulation at rising prices has preceded local tops before. If Bitcoin reaches $93K, BTC dominance increases, ETH/BTC falls toward 0.026, and those 140,000 ETH bought between May 1 and May 3 are underwater against BTC even if they break even in dollar terms.
That scenario is not resolved by the accumulation data. It is a genuine risk. The ETH/BTC chart at 0.02940 does not show a base forming. It shows a level that has not broken down further, which is different from a level that has reversed.
What limits the bear case: the CryptoQuant order size data shows no distribution. Whale orders are buys, not sells. Accumulation continues at the current price, not at lower prices. If whales were exiting, the order flow would look different. It does not.
The ETH/BTC Level That Confirms or Kills the Trade
The confirmation signal is ETH/BTC breaking and holding above 0.032 BTC within the next two to three weeks. That level, if cleared, changes the ratio from a ceiling to a floor and historically marks the beginning of ETH outperformance phases. Combined with the current on-chain accumulation, a break above 0.032 BTC would confirm that the $322 million bet placed over four days was early, not wrong.
The denial signal is ETH/BTC falling to 0.026 BTC while ETH/USD remains near $2,300. That combination would confirm that whales bought a dollar-denominated asset in a BTC-denominated cycle, and that the wait is longer than four days.
The accumulation is real. The ratio is the test. Until 0.032 BTC breaks, the whale buying is a position, not a verdict.
The information provided in this article is for educational purposes only and does not constitute financial, investment, or trading advice. Coindoo.com does not endorse or recommend any specific investment strategy or cryptocurrency. Always conduct your own research and consult with a licensed financial advisor before making any investment decisions.
The post Ethereum Holds $2,300 Amid $322M Whale Accumulation, but ETH/BTC Lags appeared first on Coindoo.


 Bengali (Bangladesh) ·
  English (United States) ·