
 1 month ago
32
1 month ago
32 
TLDR
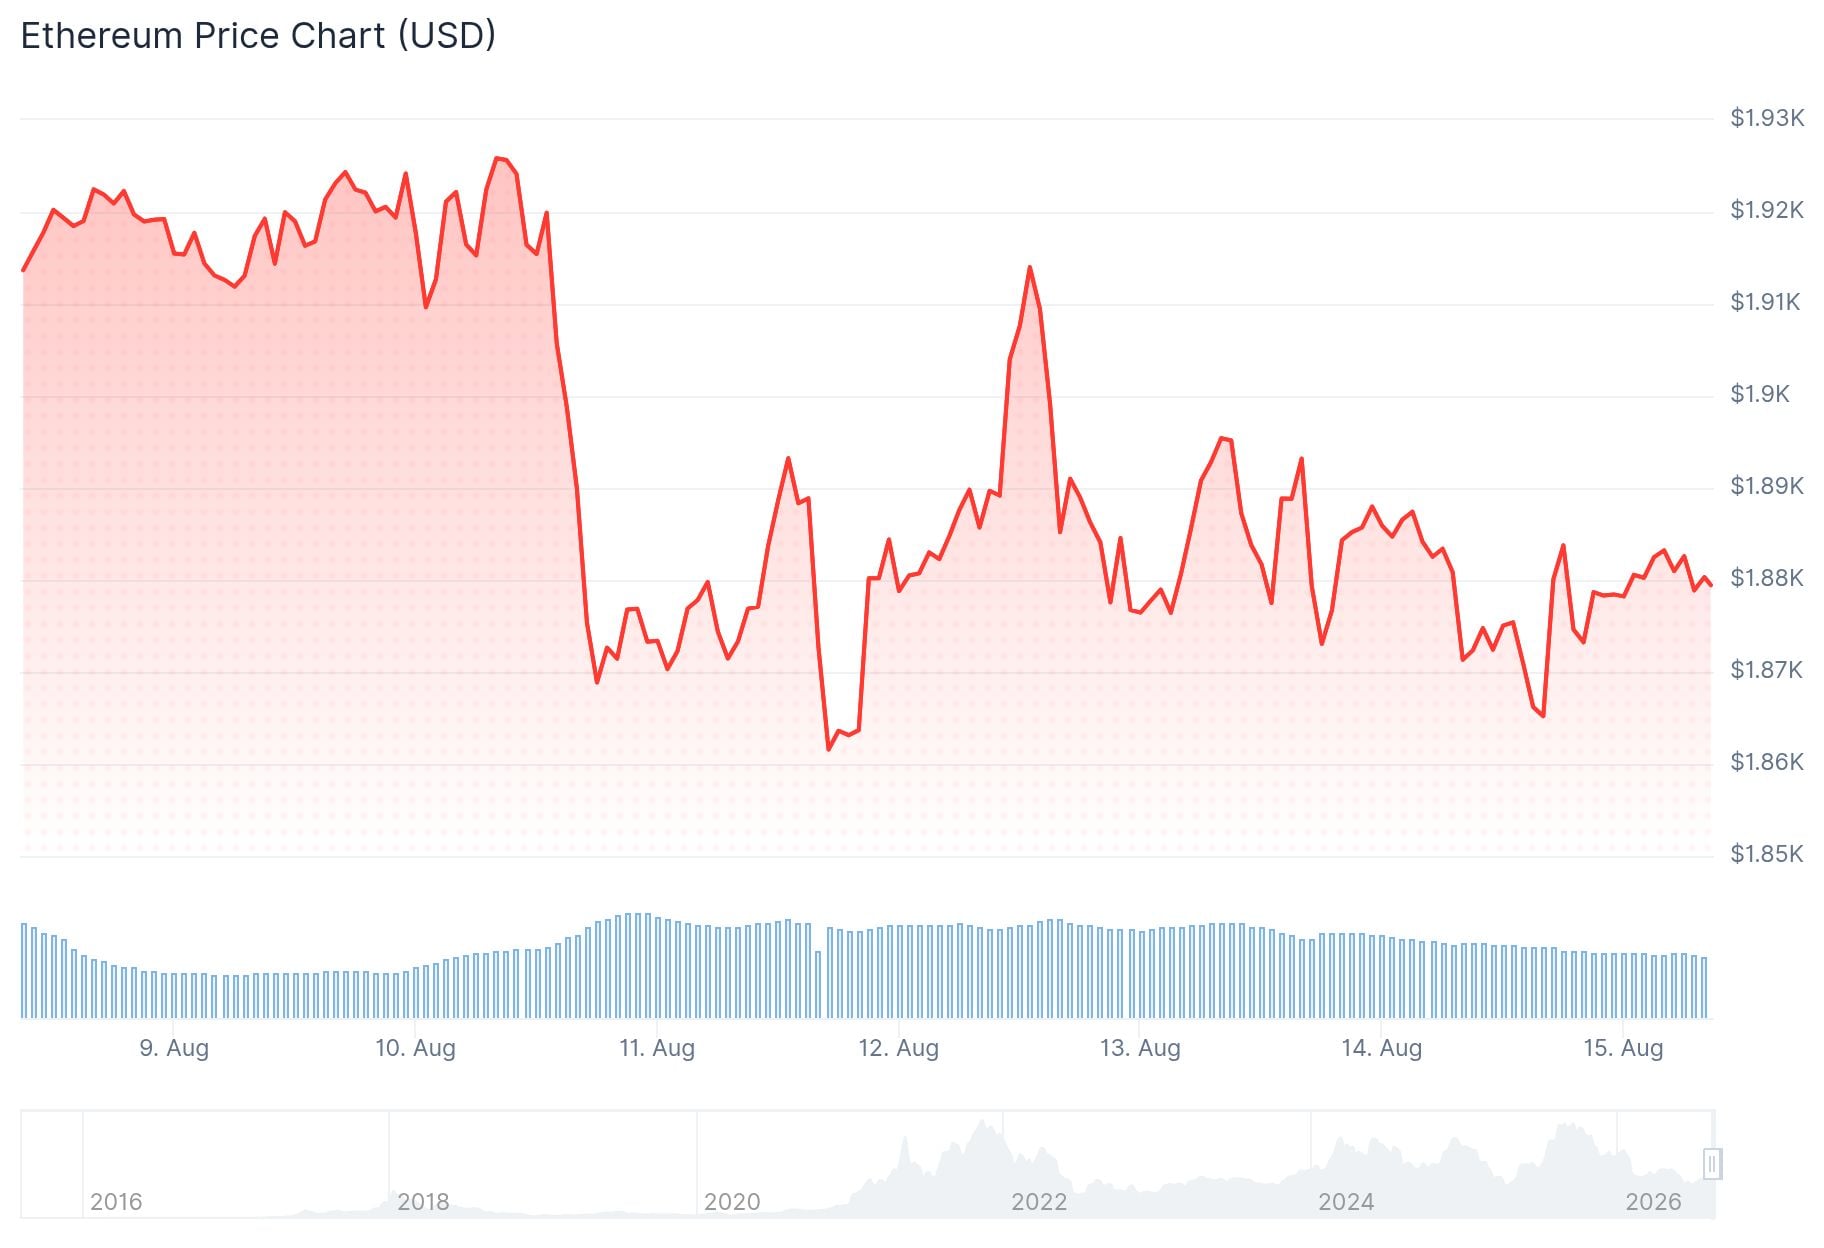
ETH is trading near $1,875, failing to hold above the $1,900 level RSI sits at 49.72, pointing to neutral-to-weak momentum Open interest dropped to its lowest since early May before recovering slightly US spot Ethereum ETFs pulled in $245 million over five consecutive weeks of inflows Key support sits at $1,850; a break below could send ETH toward $1,700Ethereum is trading around $1,875 after sellers pushed back each time the price tried to break above $1,900. ETH briefly touched $1,920 earlier this week before sliding back into its current range.
 Ethereum (ETH) Price
Buyers have been defending the $1,850 zone, but every rebound has run into selling pressure near $1,900 and $1,920. The price has been stuck in a narrow band for most of August.
On the daily chart, ETH is sitting below its 20-day moving average at $1,881 and its 50-day average at $1,893. Both of those averages are now acting as resistance right where recent rebounds have failed.
The 14-day RSI stands at 49.72, just below the neutral 50 level. Chaikin Money Flow is at -0.01, showing buying and selling pressure are nearly balanced with a slight edge to sellers.
ETF Inflows Continue Despite Flat Price Action
US spot Ethereum ETFs recorded $245 million in net inflows during the week of August 3–7, marking five straight weeks of positive flows. BlackRock’s ETHA led the way with $203 million, while Fidelity’s FETH added $24.2 million. Grayscale’s ETHE saw $4.8 million in outflows during the same period.
📈UPDATE: The Bitcoin ETFs saw another weekly net outflow of $389.7M while ETH saw a weekly net inflow of $6.7M pic.twitter.com/4QQ7PH1tlq
— Mister Crypto (@misterrcrypto) August 15, 2026
Despite that steady institutional demand, ETH has not broken through the $1,900–$1,950 resistance zone.
Analyst Daan Crypto Trades noted that ETH is caught between the $1,750 and $2,100 levels — both of which have acted as strong support and resistance over the past two years. He described $2,100 as the next key level to watch, calling the break back above $1,750 the first sign of strength, with $2,100 being the real test.
$ETH Now caught between the $1750 and $2100 levels.
Both have acted as strong support & resistance levels over the past 2 years.
ETH seems kind of in the middle of nowhere here. The big trend is obviously still down. Now the question is whether it can push higher and attempt a… pic.twitter.com/UlQwyXExjn
— Daan Crypto Trades (@DaanCrypto) August 14, 2026
Crypto analyst Ted Pillows described $1,850 as a “must-hold level” for ETH to preserve its recent gains. He sees the first upside target at $1,955, followed by $2,050 and $2,190. A break below $1,850, he said, could open a path toward $1,700.
Liquidation Clusters Sit Close on Both Sides
The CoinGlass one-week liquidation heatmap shows the heaviest upside liquidity near $1,940–$1,950, with a cluster around $1,925. On the downside, liquidity concentrations sit near $1,855–$1,860 and $1,835–$1,845.
Ethereum open interest dropped to 13.3 million ETH on Thursday, its lowest since early May, before recovering to 13.9 million on Friday. Funding rates stayed positive at around 0.0044%, reflecting a slight long bias despite reduced market participation.
ETH has recorded $26.9 million in liquidations over the past 24 hours, with $21.1 million coming from long positions.
The post Ethereum (ETH) Price: Five Weeks of ETF Inflows and ETH Is Still Range-Bound – What’s Next? appeared first on CoinCentral.




 Bengali (Bangladesh) ·
  English (United States) ·