
 1 hour ago
4
1 hour ago
4 
TLDR
Dogecoin whales dumped 40 million DOGE in 24 hours, creating selling pressure on the market Price currently trades at $0.23, below the 20-day moving average but above daily support at $0.218 Technical indicators show bearish momentum with RSI at 43 and MACD crossing into negative territory Weekly chart structure remains bullish as long as support between $0.216-$0.209 holds Technical analysis suggests potential for explosive rally to $1.30 based on repeating wave patternsDogecoin faced heavy selling pressure in the past 24 hours after large investors dumped approximately 40 million DOGE tokens. This massive distribution event has created fresh downward pressure on the meme cryptocurrency’s price action.
40 million Dogecoin $DOGE sold by whales in the last 24 hours! pic.twitter.com/VpKLI2hm87
— Ali (@ali_charts) September 27, 2025
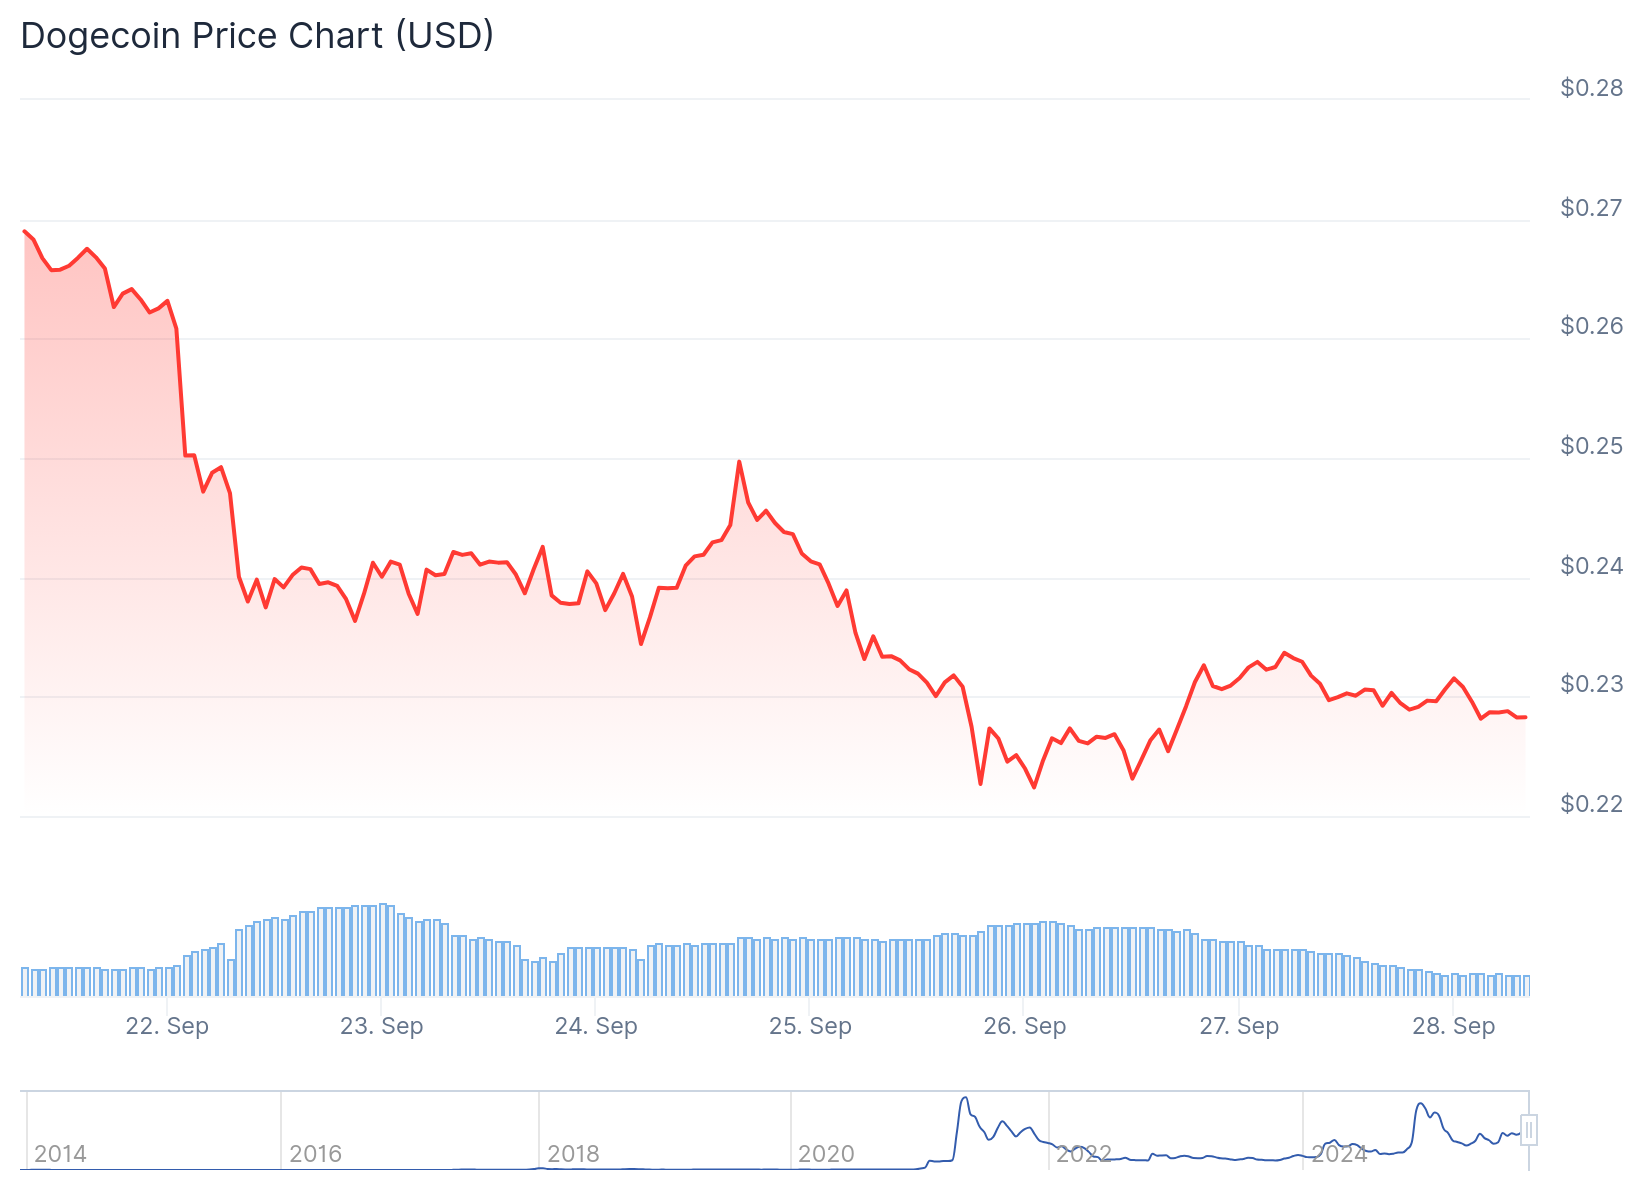
The selling wave was first reported by market analyst Ali, who tracked the whale movements across the network. DOGE currently trades around $0.230, positioning itself below the 20-day simple moving average of $0.256.
 Dogecoin (DOGE) Price
Despite the recent weakness, the price maintains its position above the lower daily band at $0.218. This level represents a crucial support zone that bulls need to defend in the coming sessions.
Technical indicators paint a bearish picture for the short term. The relative strength index has dropped to 43 from the mid-50s, showing weakening momentum without reaching oversold conditions.
The MACD has crossed into bearish territory while the Awesome Oscillator moved below zero. These signals indicate increasing downside momentum in the near term.
The Chaikin Oscillator displays strong negative flows at -12.6 million, highlighting ongoing money outflows from the cryptocurrency. This metric confirms the selling pressure created by the whale distribution.
Short-Term Outlook Suggests Pullback
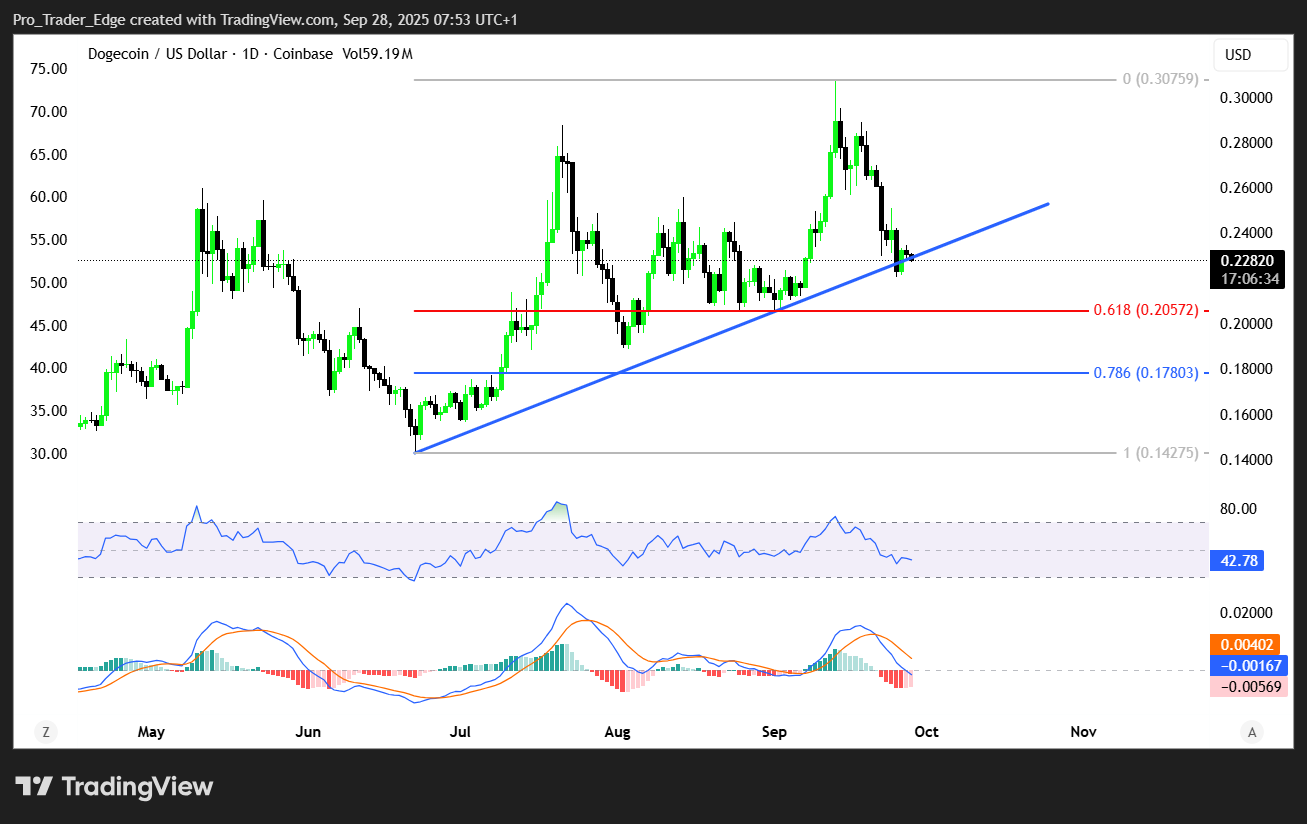
Market probabilities favor a retreat to the $0.225-$0.218 area within the next one to two weeks. This zone coincides with the daily lower band and the weekly 20-EMA, making it a critical level for bulls to defend.
 Source; TradingView
If this support shelf holds, DOGE could rebound to the $0.245-$0.256 resistance area. This zone aligns with the mid-Bollinger band and the 20-day simple moving average.
A break below $0.218 on the daily chart or $0.209 on the weekly timeframe would open the door for steeper corrections. In such a scenario, the Fibonacci levels at $0.196 and $0.188 could come into play.
These lower levels correspond to longer-term moving averages that have historically provided strong support. The weekly chart shows prices remain above all major exponential moving averages at $0.225, $0.214, $0.188, and $0.154.
Long-Term Structure Points to Explosive Rally
Despite short-term headwinds, Dogecoin’s weekly structure maintains its bullish configuration. Technical analysis suggests the cryptocurrency sits on a powder keg ready for an explosive breakout.
Pattern analysis reveals Dogecoin follows repeating waves of expansion on weekly timeframes. The first cycle in late 2023 delivered a 300% surge from consolidation.
$DOGE Setting Up for Next Explosive Move?
Dogecoin follows a repeating structure:
300% =>500% => now targeting 800% rally
Price bouncing off ascending trendline support
Target = ~$1.30 if pattern repeats again!
History rhyming or just hype?#DOGE #Crypto pic.twitter.com/bbymXSaNjN
— 𝐊𝐚𝐦𝐫𝐚𝐧 𝐀𝐬𝐠𝐡𝐚𝐫 (@Karman_1s) September 25, 2025
A second wave in 2024 produced a 500% rally from trendline support to resistance. Each cycle began with a bounce from an ascending white trendline that acts as the backbone of the long-term uptrend.
The current pattern setup suggests an 800% rally could be in the making. This projection would push Dogecoin past its all-time high of $0.7316 and above the $1 psychological level.
Technical projections indicate a potential price target around $1.30 if the pattern completes. This would represent an extraordinary move that aligns with Dogecoin’s historical tendency for explosive rallies.
A broader channel analysis spanning four years shows price action contained within colored bands since the 2021 breakout. The lower orange line consistently acts as support while the green midline serves as a pivot point.
The upper blue resistance band sits in the $0.70 to $1.00 range, representing the next major target zone. Breaking above the green midline around $0.40 would be the first step toward reaching this upper band.
The long-term bull trend remains intact as long as weekly support between $0.216 and $0.209 holds firm. Potential targets include $0.27, $0.285, and the psychological $0.30 level within four to six weeks.
The post Dogecoin (DOGE) Price: Weekly Structure Remains Bullish Despite Massive Whale Selling appeared first on CoinCentral.


 Bengali (Bangladesh) ·
  English (United States) ·