
 22 hours ago
7
22 hours ago
7 

Buyers are closely watching critical support zones, convinced that one final dip could trigger a powerful shift in momentum. The mood across the market reflects both caution and optimism, with many seeing an explosive outcome ahead.
Long-Term Symmetrical Triangle Signals Major Move
A recent X post highlighted a multi-year symmetrical triangle pattern that has contained Chainlink’s price within converging boundaries. The setup points to a potential dip toward $16, a level viewed as the most crucial foundation for the bullish thesis. This zone represents the ascending support line of the triangle and has become a magnet for whale accumulation, signaling that large holders see it as a strategic entry point.
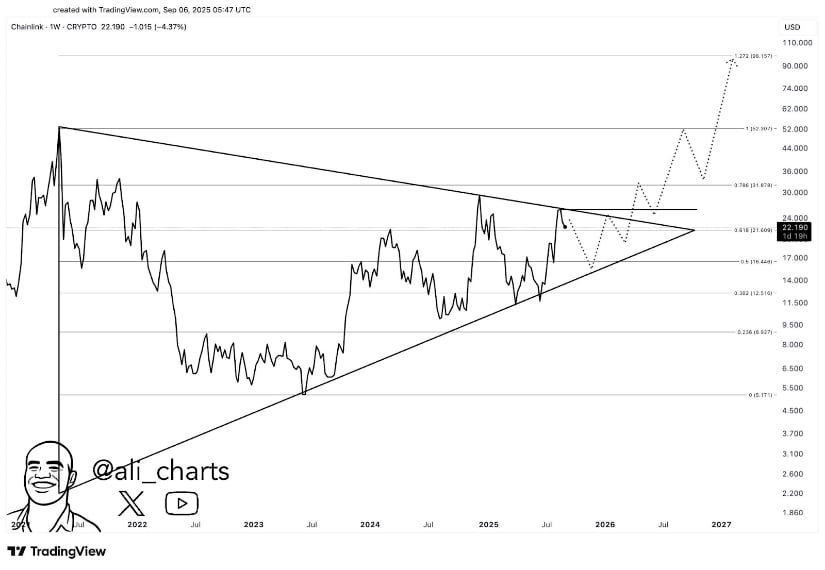
Source: X
From there, attention turns to the overhead barriers. The $25–$27 range is the first hurdle, and a strong breakout above it would open the door toward the macro pivot at $31. History shows this level has repeatedly capped rallies, making it a defining point for a broader trend reversal. If momentum carries the crypto coin through, the path toward its previous all-time high around $50–$52 comes sharply into focus.
The long-term projection extends even further. By measuring the height of the symmetrical triangle, the structure suggests a possible trajectory toward $100 once the breakout fully develops. While this ambitious target may not materialize overnight, it reflects the magnitude of a move after years of consolidation..
Short-Term Market Performance
In addition, BraveNewCoin data added further context to Chainlink’s current positioning. As of September 6, 2025, the token is priced at $22.29, reflecting a slight 24-hour decline of 0.23%. The token now holds a global market rank of 13, backed by a market capitalization of approximately $15.1 billion. This snapshot highlights steady valuation despite the modest intraday drop.
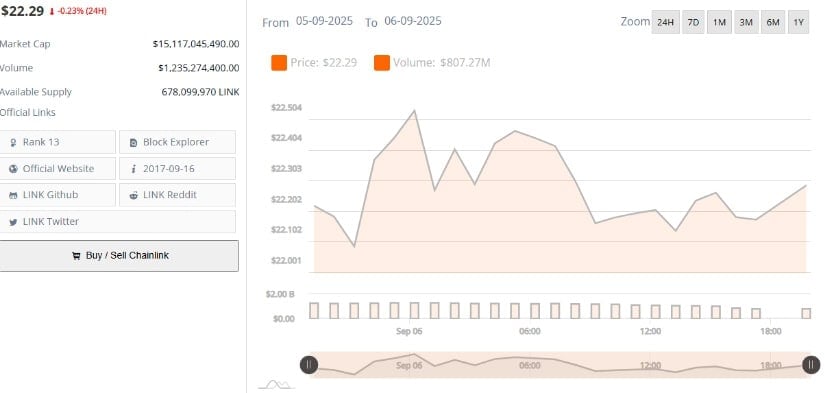
Source: BraveNewCoin
The 24-hour chart captured the crypto coin movement between September 5 and September 6, showing price swings within a narrow range. The token reached an intraday peak near $22.45 before entering a downward trend for most of the session. Toward the close of the period, a minor recovery was recorded, signaling ongoing support from buyers defending current levels.
Additional market metrics provide further insight into the asset liquidity and activity. Daily trading volume stands at roughly $1.23 billion, supported by an available supply of 678,099,970 tokens in circulation. These figures underscore the token’s established presence, with consistent engagement from holders and active participation across major exchanges helping maintain its market stability.
TradingView Chart Highlights Bearish Momentum
At the time of writing, according to the TradingView chart, Chainlink was priced at $22.05, reflecting a 1.03% daily decline. This follows a strong rally in early August that pushed prices as high as $27.87 before sellers regained control. Since then, the market has been trending lower, with the memecoin now hovering just above a key support level at $19.53, marked by the blue line on the chart.
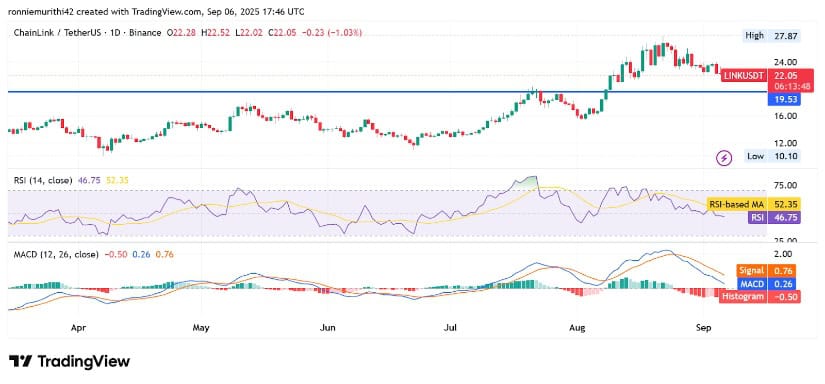
Source: TradingView
The technical indicators reinforce this bearish tone. The MACD line is positioned below the signal line, with histogram bars turning more negative, pointing to growing downward momentum. This alignment typically signals an extension of selling pressure, particularly when paired with weakening buyer interest. Traders view this setup as a cautionary sign that the crypto may continue to test lower zones in the short term.
Adding to the outlook, the Relative Strength Index (RSI) currently sits at 46.75, which is below the neutral 50 level. This reading confirms that bearish forces outweigh bullish activity, though it also suggests he asset is not yet in oversold territory. Market watchers believe the $19.53 support will be the critical level to hold, as a breakdown below could deepen losses, while a rebound may provide the foundation for a potential trend reversal.


 Bengali (Bangladesh) ·
  English (United States) ·