
 1 month ago
36
1 month ago
36 
LINK Did Not Move on the Forecast Day
Standard Chartered’s August 10 forecast put LINK at $13 by the end of 2026 and $200 by 2030, but the market did not react that day. Price remained around $8.22-$8.26, below the 0.382 Fibonacci retracement and 100-day simple moving average. The forecast preceded the rally, but the timing alone does not show that it caused the buying.
The first response came one day later. LINK gained about 6%, cleared the upper edge of its late-July range and reached the 200-day SMA. As our previous Chainlink analysis explained, the 200-day average and the 0.5 Fibonacci retracement near $8.9 still stood in the way.
LINK spent the following sessions around that cluster, moved above the 0.5 level and accelerated on August 15. The latest candle opened near $8.95, reached $9.7 and is around $9.5 at the time of writing.
The New Support Test Sits at $8.80-$9
As the daily chart shows, LINK is now above the 50-day SMA at $8.20, the 100-day SMA at $8.5 and the 200-day SMA at $8.8. The last of those averages sits just below the 0.5 Fibonacci retracement at $8.9, forming the cluster that capped the earlier move. LINK has now cleared both and pushed through the 0.618 retracement near $9.4.
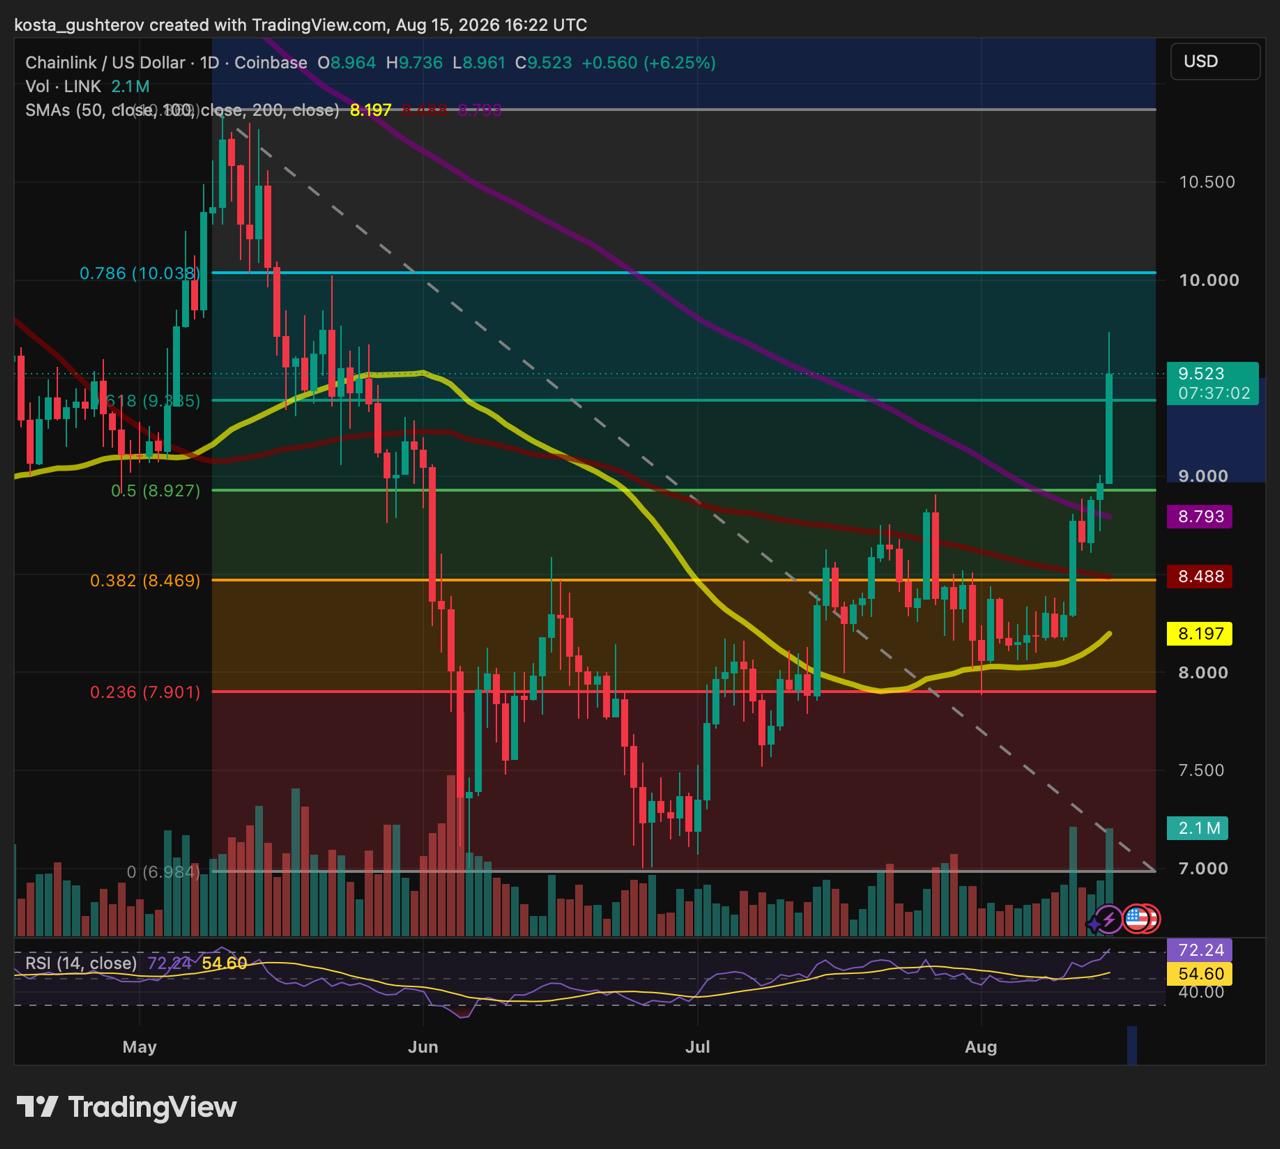 Chainlink daily price chart highlighting a bullish breakout toward the $9.5.
The August 15 candle is still open, so the move above $9.4 remains intraday for now. A daily close above it would strengthen the break, but only a later defense of the level could confirm it as support. Falling back below it would be less decisive because the stronger support band lies between roughly $8.80 and $9, where the 200-day SMA, the 0.5 retracement and the former price ceiling overlap.
A pullback into that band followed by a recovery would leave the structure intact by showing that buyers are willing to defend former resistance. A daily close below the 200-day SMA near $8.8 would be more damaging and bring $8.5 back into focus. That lower cluster contains the 0.382 retracement and 100-day SMA and marks the top of the old range.
$10 Is Next, but Momentum Is Already Stretched
The 0.786 Fibonacci retracement sits at $10, almost exactly on the psychological $10 level. The same area acted as a pivot during the May decline. A break above it would leave the May reference high near $11 as the next visible level.
Daily RSI has risen to about 72, above the conventional overbought threshold of 70. That reading does not predict an immediate reversal, but it shows how quickly the move has become extended. Volume had reached 2.1 million LINK for now, already elevated compared with many recent sessions. Both readings remained incomplete with several hours left before the daily close.
Technical indicators and price levels describe current market conditions and do not guarantee future performance. Market data can change quickly, particularly before a daily candle closes. This article is for informational purposes only and is not investment advice.
The post Chainlink Reclaims Every Major SMA as $10 Comes Into View appeared first on Coindoo.




 Bengali (Bangladesh) ·
  English (United States) ·