

A cryptocurrency analyst has explained how a Chainlink triangle breakout setup could point to a massive $100 target for the asset’s price.
Chainlink Is Coiling Inside A Triangle Right Now
In a new post on X, analyst Ali Martinez has talked about a triangle pattern forming in the weekly price of Chainlink. Triangles refer to consolidation channels from technical analysis (TA) that involve an asset trading between two converging trendlines.
Like any other consolidation channel, the upper trendline acts a source of resistance, while the lower one that of support. In other words, tops can be likely to occur on retests of the former and bottoms at the latter.
There are a few different types of triangles, with some of the popular ones being the ascending, descending, and symmetrical variations. The orientation of the trendlines decides which type a particular triangle falls into.
Ascending and descending triangles have one trendline parallel to the time-axis: upper line in the former and lower one in the latter. Symmetrical triangles lie between the two, having both lines at a roughly equal and opposite slope.
Chainlink has potentially been trading inside a triangle over the last few years, but as the below chart shared by Martinez shows, this particular triangle doesn’t cleanly fit into any of these types.
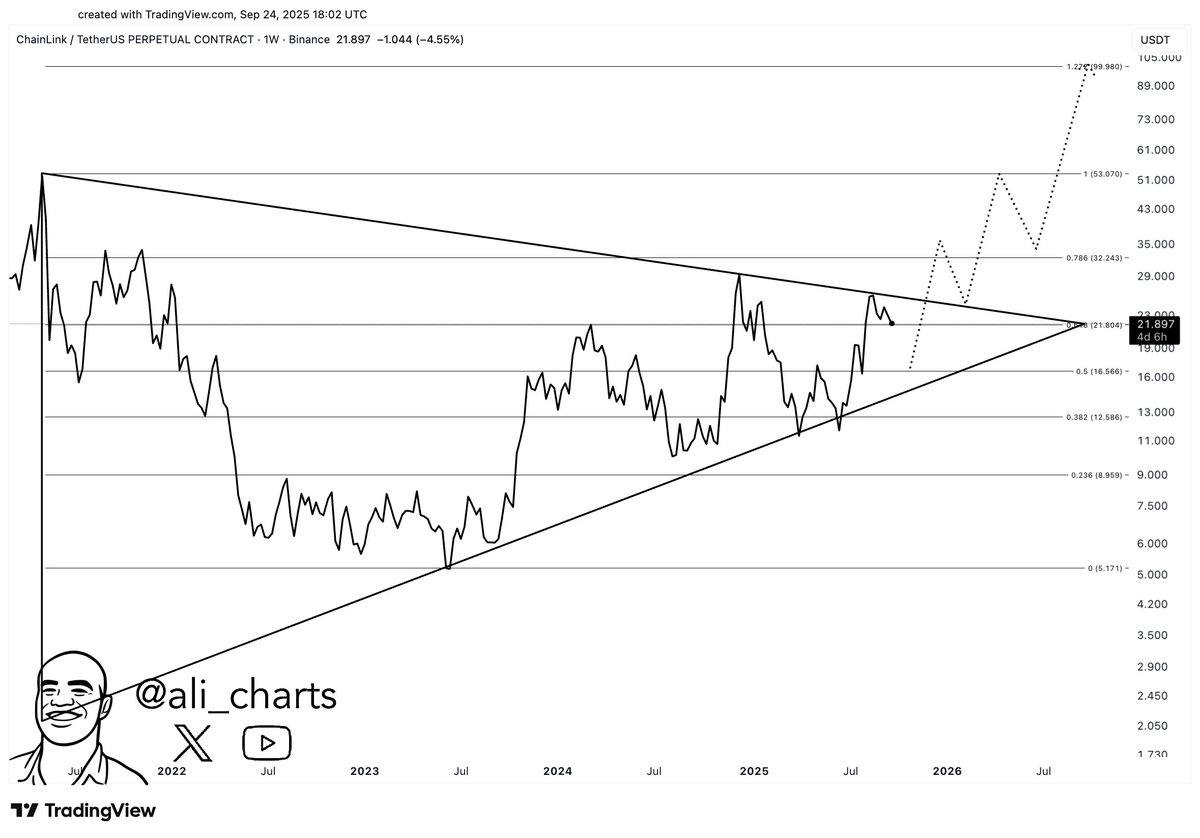
From the graph, it’s visible that Chainlink’s triangle lies is angled upward, but not fully, so it lies somewhere between a symmetrical triangle and an ascending one.
LINK made a retest of the upper line of the pattern earlier in the year and ended up finding rejection. The cryptocurrency is now on the way down, but the analyst thinks an extended drawdown may not actually be so bad.
“A dip to $16 on Chainlink $LINK would be a gift,” says Martinez. This price is where the 0.5 Fibonacci level lies. Fibonacci Extension/Retracement levels are lines drawn using ratios derived from the famous Fibonacci series.
The analyst has taken LINK’s top and bottom from the last few years as the 1 and 0 levels, respectively, and has drawn retracement levels between them. The $16 mark happens to be where one such key retracement level lies.
Martinez has highlighted in the chart what path the asset could end up following if it bounces off this level. It would appear that in the analyst’s view, a rebound from the line could end up leading to a breakout from the triangle and set a potential target at the 1.272 extension level, drawn up from the 1 level (top). In Chainlink price terms, this level corresponds to almost $100.
It now remains to be seen whether LINK will break out of the triangle in the near future, and whether a setup similar to the analyst’s would play out.
LINK Price
At the time of writing, Chainlink is floating around $20.25, down over 17% in the last seven days.


 Bengali (Bangladesh) ·
  English (United States) ·