
 14 hours ago
2
14 hours ago
2 
Key Takeaways
Bitcoin slips below $78,500 as sellers stay active
Bitcoin fell as low as $78,350 on Bitstamp on September 8 before recovering slightly. BTC is now trading between its first Fibonacci support near $76,600 and the $79,500-$80,000 area it needs to reclaim.
Since Bitcoin broke above the 23.6% Fibonacci retracement near $76,580 in late August, that level has acted as its first daily support. The latest pullback tested the area, but BTC quickly moved back above it, keeping the recovery structure intact for now.
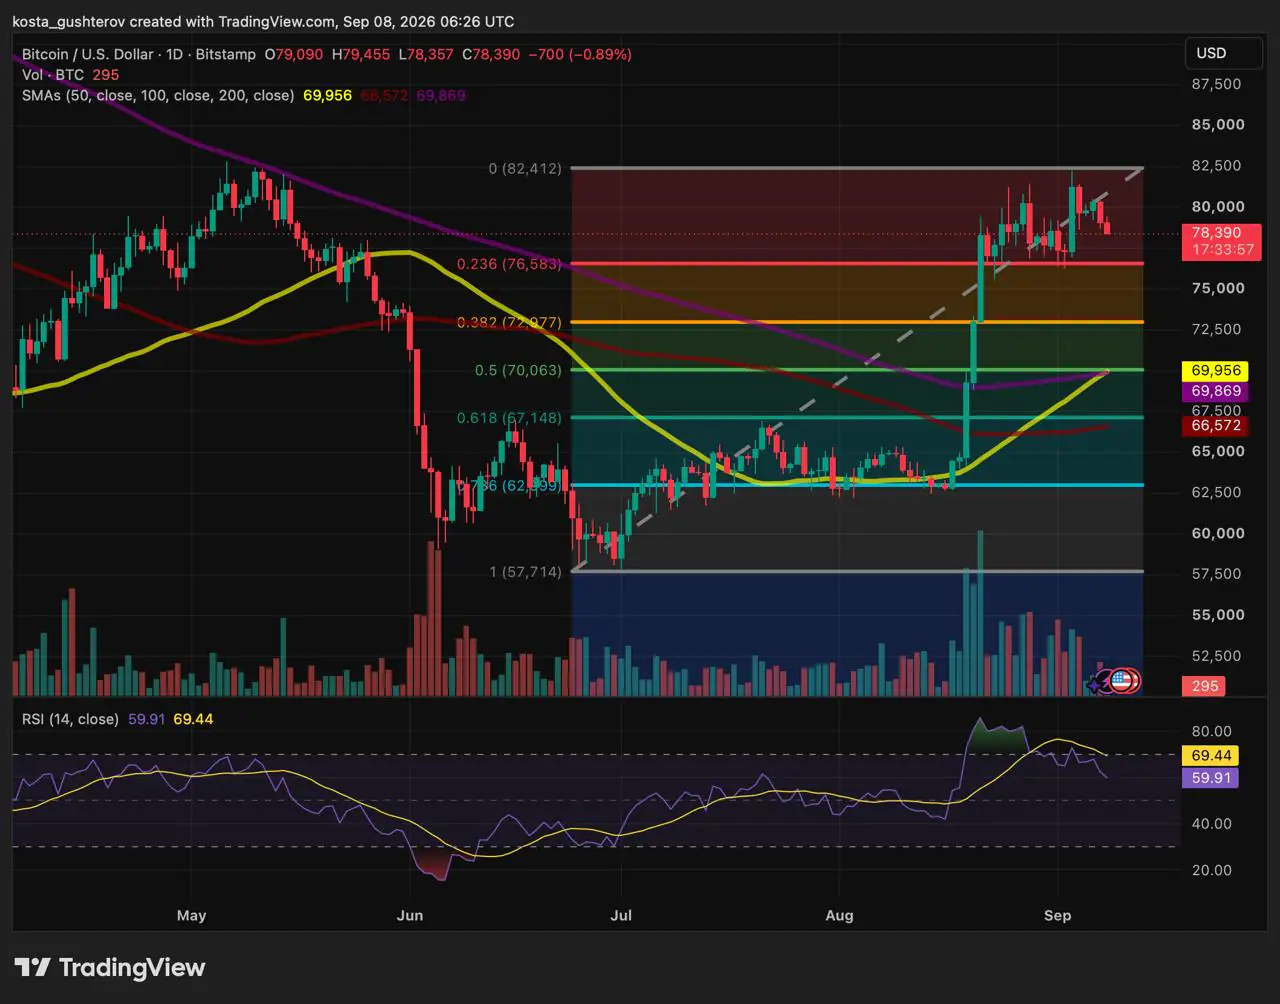 Bitcoin (BTC/USD) daily price chart showing Fibonacci retracement levels and the 50- and 200-day simple moving averages converging near $70,000. Source: TradingView, Bitstamp.
If BTC loses $76,600 on a daily basis, the next Fibonacci support sits near $73,000. Above the market, $82,400 remains the wider resistance zone after the recent failed move above $82,000.
Bitcoin’s short-term levels
BTC/USD levels to watch
| $82,400 | Recent recovery high and the main resistance zone. |
| $79,500–$80,000 | Immediate area BTC needs to reclaim after the pullback. |
| $76,600 | 23.6% Fibonacci retracement and first daily support. |
| $73,000 | 38.2% Fibonacci retracement and the next downside test. |
| Near $70,000 | 50% Fibonacci retracement and the meeting point of the 50- and 200-day averages. |
How the golden cross aligns with $70,000 support
A golden cross forms when the 50-day simple moving average rises through the 200-day average from below. Traders consider it bullish because recent prices are strengthening faster than the longer-term trend, although the crossover is a lagging signal and cannot predict the next daily move on its own.
In this case, the crossover matters even more because it formed almost exactly at the 50% Fibonacci retracement. The 50-day average is near $69,956, the 200-day average near $69,869 and the 50% retracement near $70,063.
Those levels create a clear support cluster. A decline toward $70,000 would still weaken the short-term setup, but it would bring BTC into a stronger technical floor after the two nearer Fibonacci supports.
Binance futures data shows selling pressure
Binance futures data shows that aggressive sellers still have the upper hand despite Bitcoin’s rebound from the latest dip. A CryptoQuant analysis of Binance’s Bitcoin taker buy/sell ratio placed the reading near 0.917 as BTC traded around $79,000.
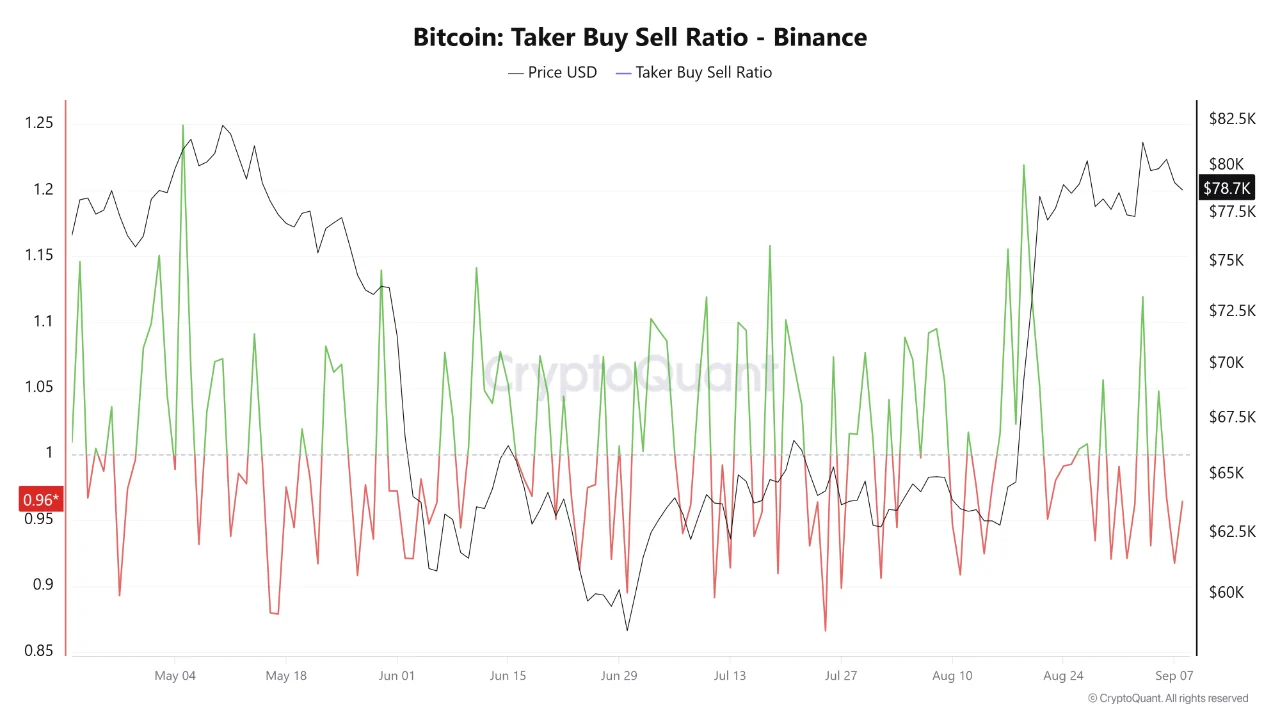 Bitcoin Binance Taker Buy Sell Ratio chart tracking aggressive buyer and seller order dominance relative to price trends.
The ratio compares market buy volume with market sell volume. These are orders executed immediately against available liquidity, rather than limit orders waiting in Binance’s order book. A reading below 1 means taker sell volume exceeded taker buy volume during the measured period, showing that sellers were more willing to accept current bids than buyers were to lift current offers.
That does not measure all Bitcoin demand or prove that a wider downtrend has begun. It tracks Binance futures only, and it says nothing about spot-market flows, ETF activity or positioning on other derivatives venues. It is most useful as a short-term measure of who is driving executed futures trades.
CryptoQuant’s chart shows that the ratio has moved above and below the neutral level several times since May. Readings above 1.10, and, at times, 1.20, coincided with stronger upside phases in May and August, while sub-1 readings also appeared repeatedly through June, July and August. The current 0.917 reading therefore signals active selling pressure, not a standalone call that Bitcoin’s recovery has ended.
For BTC to reclaim the nearby resistance area, traders would want to see price recover alongside a ratio back above 1. That would show aggressive buyers, rather than sellers, are again setting the pace in Binance futures trading.

Inflation data and Iran tensions remain in focus
Investors are waiting for U.S. August inflation data: the Producer Price Index is due on September 10, followed by the Consumer Price Index on September 11. The releases matter because they can change expectations for the Federal Reserve’s September meeting.
The PPI and CPI releases are among five events that could move crypto markets this week. Higher-than-expected inflation could reinforce expectations for restrictive policy, while softer readings would reduce that pressure on risk assets.
Unresolved U.S.-Iran tensions remain another source of uncertainty for energy markets and overall risk appetite.
Bitcoin’s next test
Bitcoin needs to hold the first support and reclaim the nearby resistance area to reopen a move toward $82,400. A break below support would bring $73,000 into focus, with the golden-cross cluster near $70,000 forming the more important level below it.
This article is for informational purposes only and does not constitute financial advice.
The post Bitcoin Price Dips Under $78.5K as Golden Cross Forms appeared first on Coindoo.





 Bengali (Bangladesh) ·
  English (United States) ·