 3 hours ago
5
3 hours ago
5 
Key Takeaways
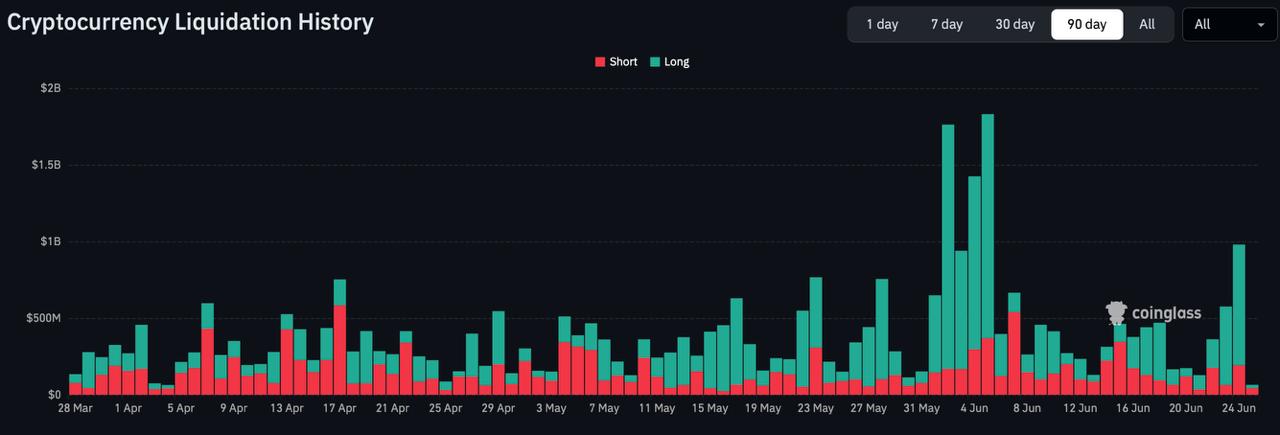
Bitcoin and Ethereum are bouncing from yesterday’s lows of $59,010 and $1,550. Total crypto liquidations hit $1 billion over 24 hours across 177,031 traders. The drop was a long squeeze; the bounce is now squeezing recent shorts. Bitcoin spot ETFs saw a $469M outflow on June 24, accelerating the break. Thin recovery volume suggests short covering more than fresh buying.On the 2-hour charts, the recovery is clear but worth reading carefully. Bitcoin climbed $2,697, about 4.57%, off its low over roughly 14 hours.
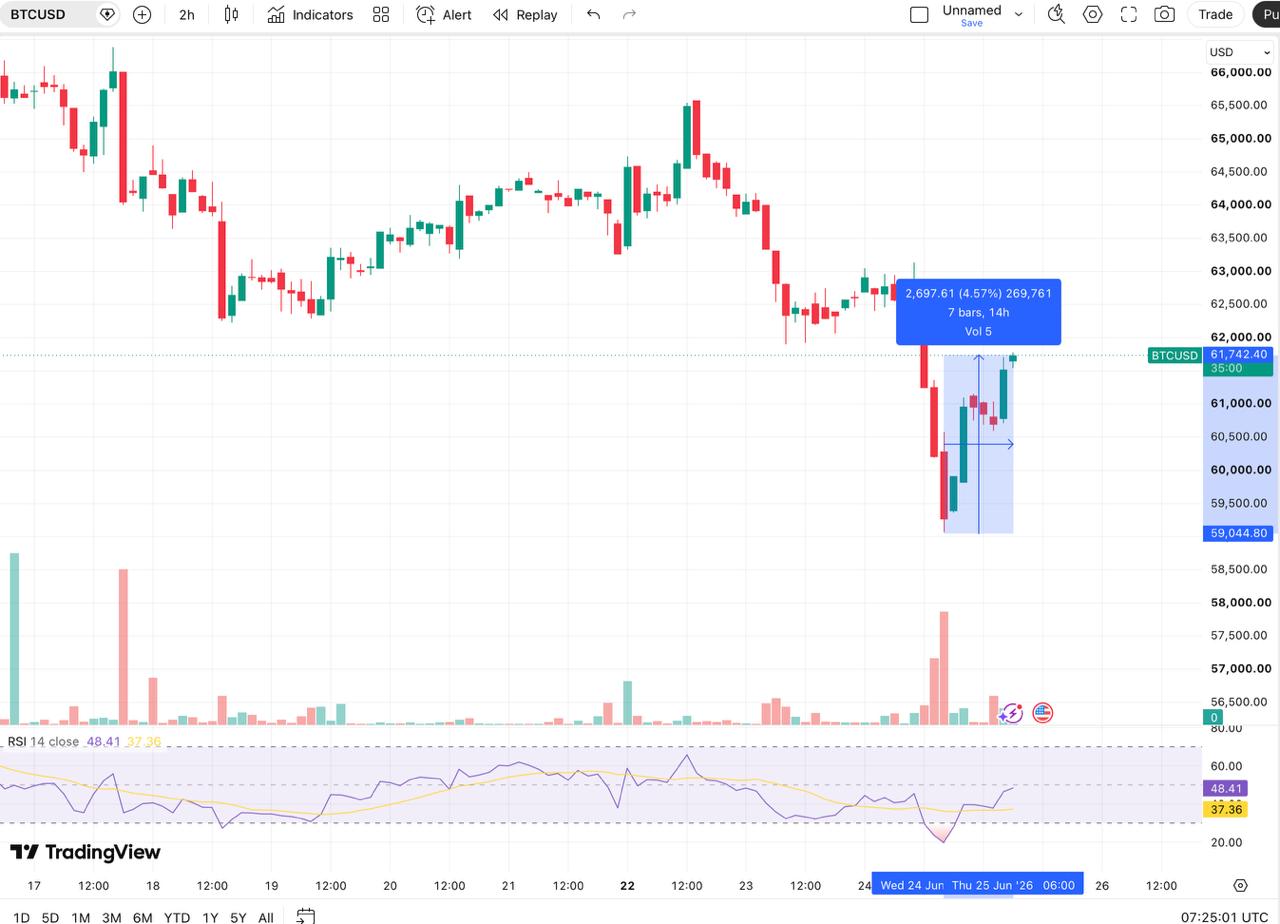
The character of the move matters more than the size, though. Bitcoin’s recovery candles came on thin volume, which points to short covering rather than aggressive new buying. Its 2-hour RSI has climbed back to 48.41 from deeply oversold levels, but with the signal line at 37.36 still below, momentum is turning without yet confirming a reversal.
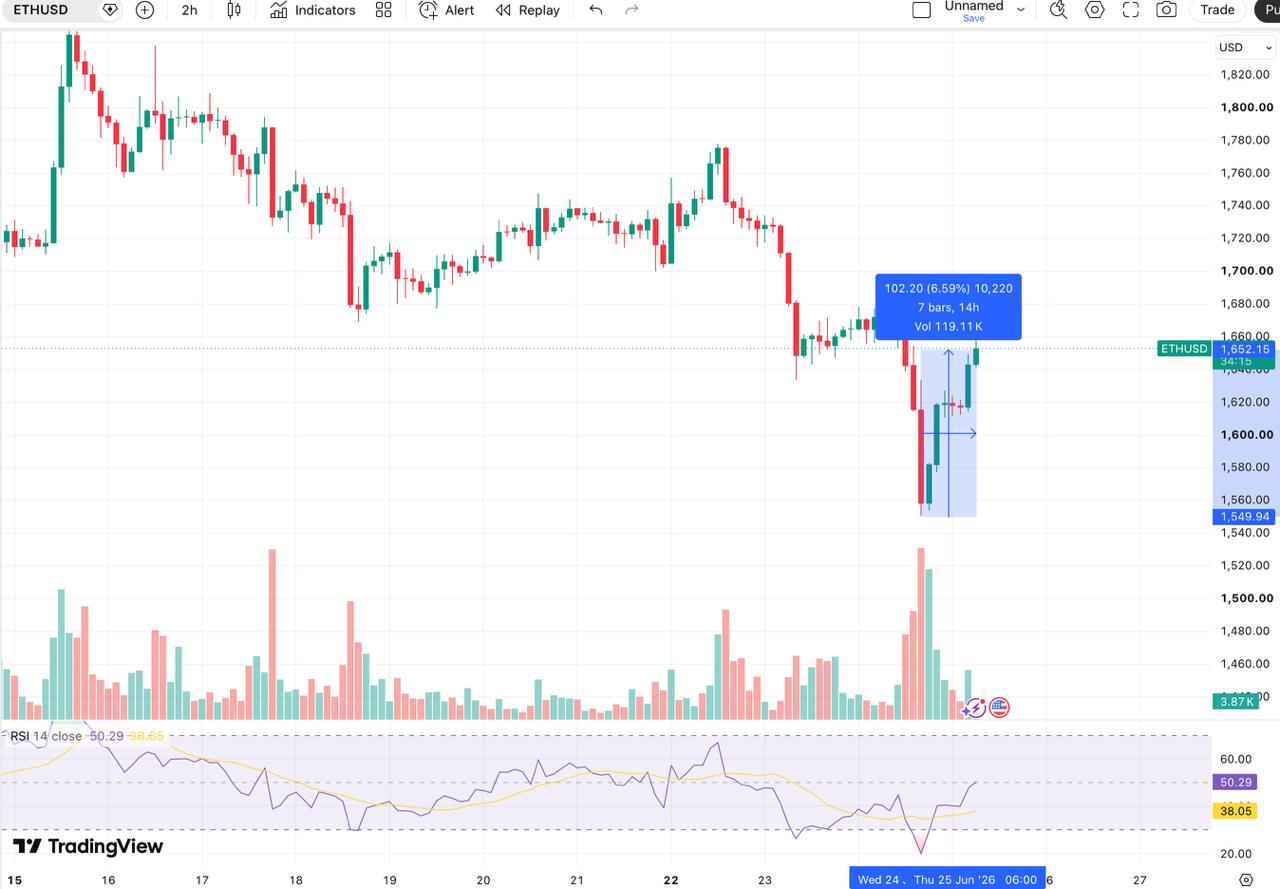
Until the time of writing Ethereum recovered $102, or 6.59%, across the same window. ETH’s percentage bounce is actually the larger of the two, notable given how much it had been underperforming lately. Volume was more substantial, and its RSI at 50.29 has crossed above its signal line at 38.05, the first bullish crossover on the 2-hour in days. So ETH shows slightly more conviction, but neither chart has confirmed a durable turn.
What Set Yesterday’s Lows: A Liquidation Cascade
It looks like the $59K and $1,550 prints were not only organic selling but also forced. Total crypto liquidations hit exactly $1 billion over 24 hours across 177,031 traders, with the single largest a $12.21 million BTCUSDT position on Binance. The composition tells the story.
| Bitcoin | $319.23M | $95.50M |
| Ethereum | $170.39M | $59.64M |
| Total market | $780.96M | $219.08M |
The imbalance is the whole point. Across the market, $780.96 million in long positions were wiped versus $219.08 million in shorts, this was overwhelmingly a long squeeze, leveraged bulls getting forced out as price fell. Then the picture flipped on the way back up. In the most recent 12-hour window, $75.48 million in Bitcoin shorts were liquidated against just $3.14 million in longs, and ETH showed the same reversal with $38.09 million in shorts gone versus $3.55 million in longs. In other words, the traders who piled in short near the lows are now the ones getting squeezed, which is the mechanical engine behind today’s bounce.
The ETF Outflows That Amplified It
Forced selling wasn’t the only pressure. Bitcoin spot ETFs recorded $469.08 million in net outflows on June 24 according to SoSoValue data, the largest single-day figure in recent weeks. What makes that number more telling is the context: it isn’t a one-off bad day but the sharp acceleration of a multi-day outflow streak, jumping from the prior trend of roughly $60 to $90 million daily into a near-$470 million exit.
That marks institutional selling as a sustained trend rather than a single flush. Ethereum spot ETFs added another $30.24 million in outflows the same day. Combined, institutional products pulled about $499 million in a single session, real selling that fed directly into the break below $60K. So yesterday’s low was a combination: a leveraged long cascade landing on top of an accelerating, multi-day institutional

The Unified Read
Put it together and yesterday reads as a classic long-liquidation cascade, amplified by record ETF selling. The $59K and $1,549 lows were set on forced and institutional selling rather than slow distribution, and today’s recovery is largely short covering against those oversold levels, Bitcoin’s RSI climbing back toward 50, Ethereum’s already crossing its signal line.
The important question is whether it holds, and the bounce’s thin Bitcoin volume is the reason for caution, short-covering rallies can fade once the trapped shorts are flushed. The clearest level to watch is $61K on Bitcoin. If it holds that on a retest, the recovery has a foundation to build on; if it fails to hold $61K and slips back, the market could likely read this bounce as a dead-cat rally and the risk of a return to the $59K low might rise. Ethereum’s equivalent line sits around $1,650. Beyond the chart, the other half of the test is ETF flows, whether the multi-day outflow streak stabilizes or keeps extending. Until those resolve, this is a mechanical recovery from oversold conditions, which is a different thing from a confirmed bottom.
The post Bitcoin and Ethereum Bounce After a $1 Billion Liquidation Day appeared first on Coindoo.


 Bengali (Bangladesh) ·
  English (United States) ·